We’re very excited to announce yet another investigative Superpower in the Siren platform: real time, interactive, large scale, visual topic clustering.
A picture that’s worth 700,000 documents (and this one moves):
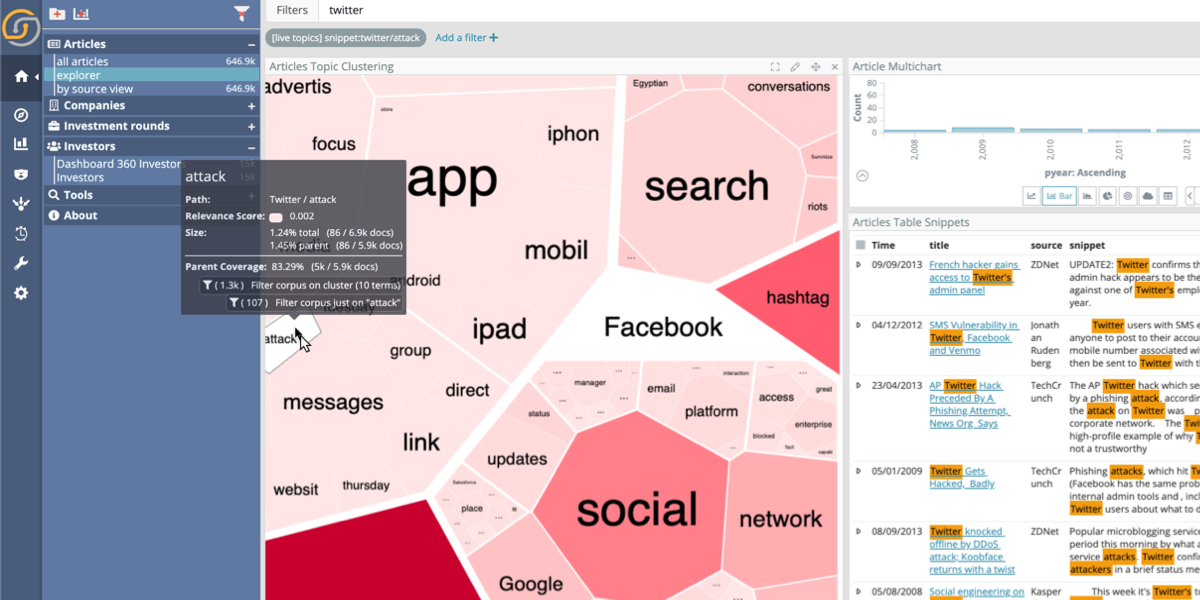
In the video above, I am exploring in real time just under 700,000 web tech articles from our “classic demo” (the one in the Siren preloaded demo distribution).
This is happening in real time, with no preprocessing, and it works dynamically on any filtered set (e.g. news in the last 20 minutes).
The new Topic Clustering component
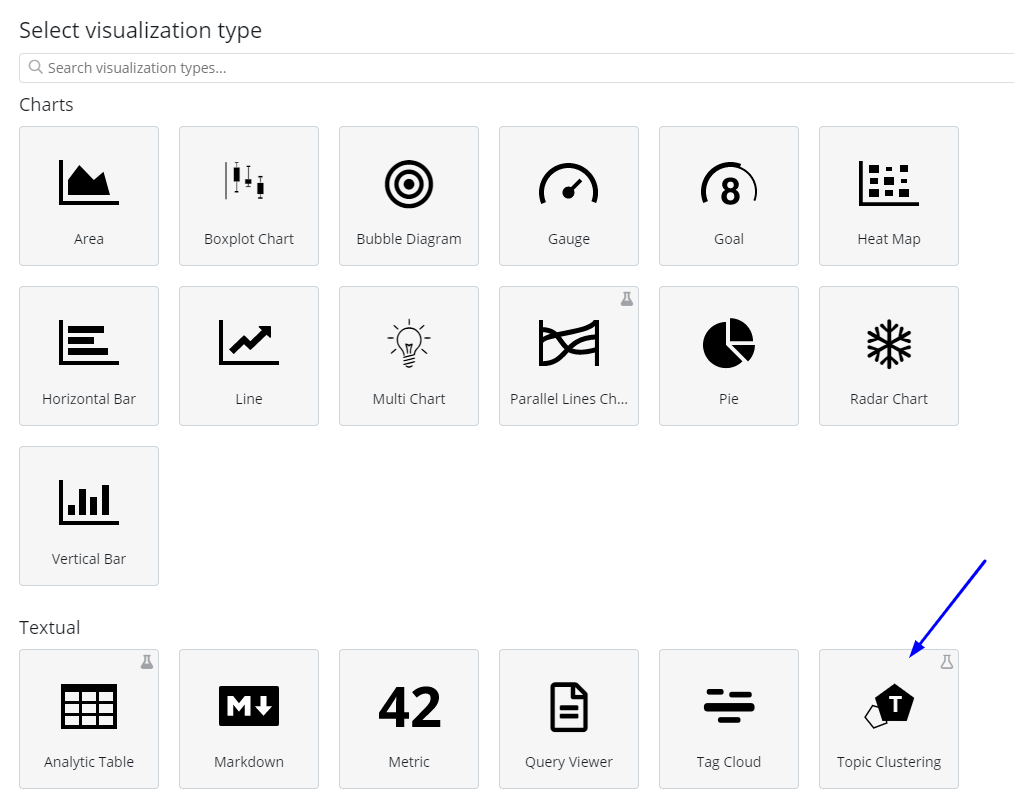
The component in question is the new Topic Clustering visualization, now available in Siren 10.3 for embedding in any dashboard.

The components works interactively, extracting the key terms and maximizing both:
- Coverage – the resulting terms must represent as much as possible of the corpus (and can be read in the tooltip)
- Significance – how the terms in a sub-selection are strongly correlated with those in the parent (reflected in the color scheme)
When you click on one of the terms, it creates filters so that all the other components (from the table of documents to any other visualizations) update to show the data referring to the selected term.
On hover, the components give much useful information and more controls:
- The coverage of the term in the tile with respect to the current selection or with respect to the parent term
- How significantly tied that term is with the parent selection (the color will also reflect this)
- The ability to create a top-level filter for that term, thereby focusing more on that one

The component performs an approximate clustering completely in real time, and this is a big deal for investigators.
Previous approaches to document clustering required the use of preprocessing; for example, a SPARK cluster computation was used to derive a “hierarchical taxonomy”, which could then be rendered similarly to this component.
Doing that has several disadvantages, the biggest being that if you add any filter to your selection (e.g. the last 48 hours, only documents mentioning “AWS”, only documents by Joe or any colleague), you would have to relaunch the computation again and come back later.
This is not the case here as the Siren Topic Explorer allows you to interactively and visually discover insights by freely filtering the underlying data.
Databases cannot do this (that’s why we use Elasticsearch)
If you have heard NoSQL is dead, think again.
It’s not a war, really – SQL systems are great for ad hoc complex questions. However, some data functions require a completely different data model where “information retrieval engines” (search engines) shine instead.
The good news is that, within Siren, you can also use the Topic Clustering visualization on database data, simply by connecting to it and activating the “data reflection” functionality.
This will create a “kept in sync” mirror of the remote database data in the internally managed Elasticsearch; as a result, you can enjoy Topic Clustering as well as many other benefits in search and drilldowns.
Playing around with some of the parameters (beta)
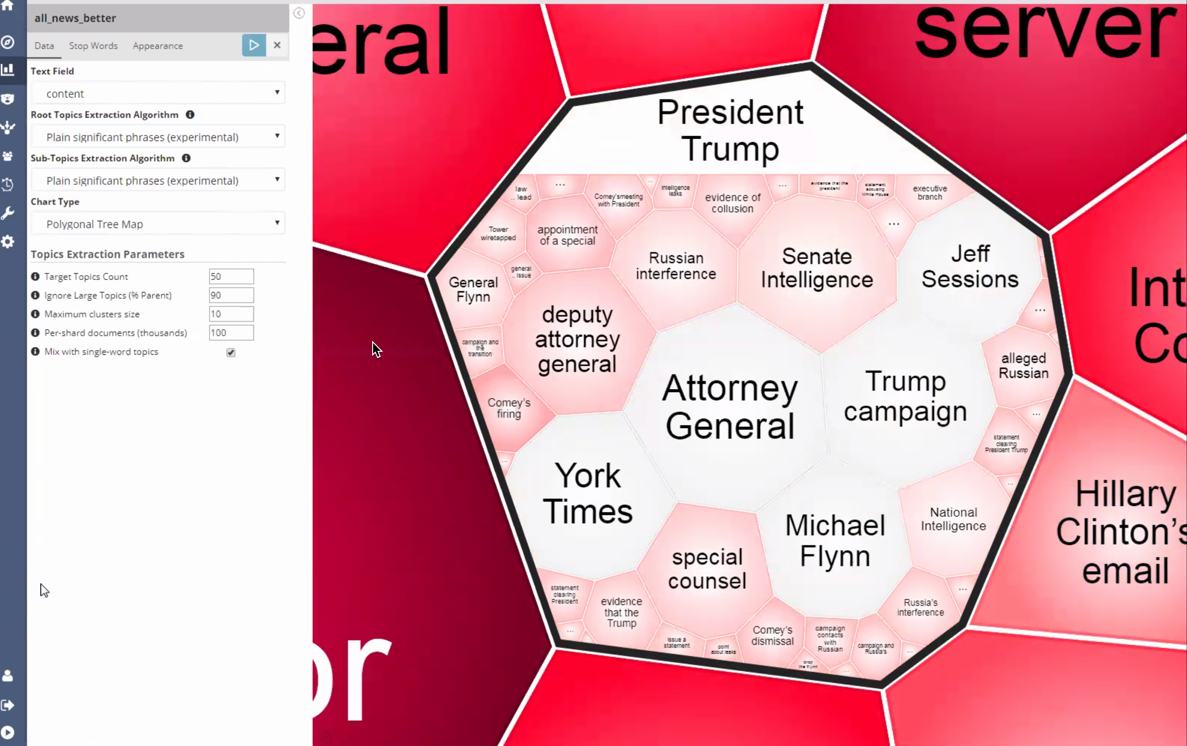
The Topic Explorer is still in beta, so it boasts possibly more configuration parameters than it should :). However, they’re interesting to play around with!
Specifically, you can choose between alternative clustering algorithms, for example, or remove unimportant words, choose color schemas, and more.

A current known limitation is that level sub-clustering (the grouping of keywords in macro clusters) does not work in conjunction with “key phrases” detection (e.g. detecting meaningful multi-word topics). This limitation will likely be removed in future releases.
Use it for free, in the Siren Community Edition
We’re happy to say that Topic Clustering is available in Siren 10.3, and also in the free Siren Community Edition. And it’s super easy to use with any data you might have around. Just drag and drop a CSV, or connect a database table, and off you go.
To this extent we have updated our Getting Started tutorial with an appendix about this new feature. You might want to check it out.
And don’t forget to let us know how it works on your dataset: your feedback will be super important for us to improve.
To do so, just write in our community or contact us directly.


