Building data lakes, collecting logs and data streams are just a few of the heavy investments that companies are making in data infrastructure.
Interactive analytics and visualizations are a vital part of this, making non-technical users able to explore and understand millions of rows of data at a glance. For this reason visualizations offered by Kibi/Kibana have become incredibly popular, and all indicators say it will be more and more so in the future.
Kibi Community Edition offers relational/cross index drilldowns and filtering based on connections to DBs and APIs.
This is a huge step forward in many scenarios with respect to stock Kibana capabilities, but sometimes more is needed.
Support for Link Analysis & Analytics via Keylines and Tinkerpop 3/ Gremlin
Sometimes, there are questions that can only be addressed by seeing interconnected data for what it really is: a knowledge graph.
For this reason Kibi Enterprise Edition, among the other things, integrates and builds upon what is likely the world most advanced JS library for graph analysis: Keylines.
Kibi/Keylines integration is not just great, but it’s also conceptually beautiful: we have gone all the way and built a fully functional Tinkerpop 3 API on top of Elasticsearch to see all your cross index/Elasticsearch data as if it was stored in a graph database like Neo4J or Titan.
This is implemented thanks to a bridge between the Kibi Relational Configuration and a Unipop derived driver, which in turns creates a full featured Kibi/Elasticsearch backed Gremlin API.
What does it mean in practice? That Kibi Graph Visualization and configurable/programmable link analytics can leverage both Elasticsearch+Siren Join queries and Graph queries written in Gremlin.
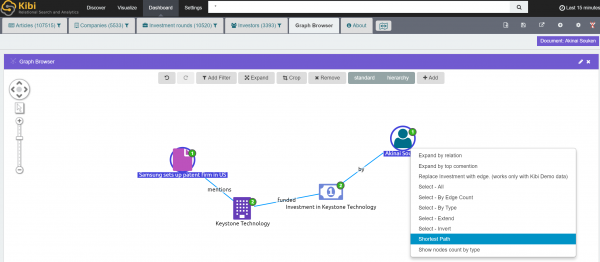
This is super cool because Elasticsearch queries can answer in a snap questions that involve aggregates across hundreds of millions entities (and relational connections, via Siren) while Gremlin queries can give you the “shortest path” between 2 nodes with just 1 line of code.
For example, you can edit in Kibi Configuration:
![]()
Turns into this function that can be launched from the graph browser:

Join us and learn more!
On Sept. 15th, at 5 pm BST, we’re co-presenting with Keylines a webinar, where we’ll demonstrate Kibi graph analytics and discuss it conceptually.
By joining us at the Webinar you will learn:
- Why relational and graph visualization should be a core component of your Dashboards
- What data questions you can answer with a graph
- How Kibi combines KeyLines with Elasticsearch for a 360-degrees data view.
This session should last 45 minutes, including Q&A.
Don’t miss it: Watch the Webinar HERE
If you cannot make this time, register anyway. We’ll send a recording to everybody who registers.
About Kibi
- Available in fully Open Source & Enterprise Edition
- Powered by some of the coolest and fastest moving open source technologies in the world
- Fully compatible with all the Kibana 4 and soon Kibana 5 Plugins, freely extensible with the same API
- With unique incredible Relational Data Drilldowns and direct connection to RDBMS & APIs for filtering
- Embedding and leveraging TinkerPop Gremlin and Keylines Graph Visualization
Kibi is now widely used in POCs & Production across the 5 continents in Industries ranging from Telecoms, IOTs, Pharmaceutical & Life Science, Defense and Homeland Security, Law Enforcement, Utilities, Telecom, Financials, Auditing, Oil and Gas, IP Security, Public Bodies, Press and Media and more.
To know more about Kibi take a look at these posts [1] [2] [3] [4] or at this short video.
Sharing means supporting us grow and develop further:
- Please Use this link to share a tweet!
- Do Sign up to our Youtube channel – new videos of Kibi Enterprise Edition soon.
- Want to stay updated with Kibi news? Make sure you’re subscribed to our Newsletter bellow.


