

One of the biggest challenges in exploring data in life sciences is fragmentation – data about molecules, diseases, genes and other entities are present on many isolated databases, be that internal or external and in many formats. They either require costly and inflexible data integration, or time-consuming workflows by performing multiple queries on each separate data source.
Furthermore, Life science data is inherently “highly interconnected”, with biological entities like molecules, genes and diseases often connected in tens if not hundreds of different ways to other domain entities.
This great “relational richness” is a big challenge for traditional BI in life science. Whereas in other domains it is easy to create “dashboards” that capture roughly the “whole story”, the complexity of life science data coupled with the diversity of questions by investigators means that even today visual analytics in Life Science is lagging behind.
Turning “disconnected tables” into a “knowledge graph” easily with a “virtualized knowledge graph”.
The term “knowledge graph” has been referred to as the idea of seeing data interconnected as a graph of relationally linked entities (e.g. Paper → published by→ author → works at→ Institution).
Given the complexities mentioned above it is natural to want to see life science data as a “knowledge graph” that one would want to freely explore and ask questions on the graph.
Knowledge graph technologies (or Graph Data approaches) are not new per se, but in the past years they have shown maturity and radical acceleration.
At Siren, we are particularly proud to play an important role in the adoption of the “knowledge graph” mentality with the core feature of our Siren platform: the ability to see (and query) data as a knowledge graph without the need to ETL into a new system.
In other words, the Siren Platform™ allows you to see the “knowledge graph” in your data, where it already resides (Relational Databases, Elasticsearch, Hadoop via Spark or Impala and others).
External public data and internal proprietary data can be leveraged as one, and the data can be explored via link analysis, a more natural way of looking at multiply-connected data than tables or other traditional visualizations.
We call this “virtualized knowledge graph” capabilities.
A workflow example for drug repositioning investigation on a virtualized knowledge graph.
In searching for potential new treatments for a particular disease, typical questions to ask might be “which diseases are treated using the same drug(s) as my disease of interest?”, and “are there any other treatments for those diseases that might be worth exploring?”. Such investigations typically would involve multiple queries, potentially across multiple databases. With a virtualized knowledge graph one can get answers in a few simple steps.
But before continuing a disclaimer: the following examples are for illustrative purposes only and do not constitute medical advice.
Let us start from our list of molecules.
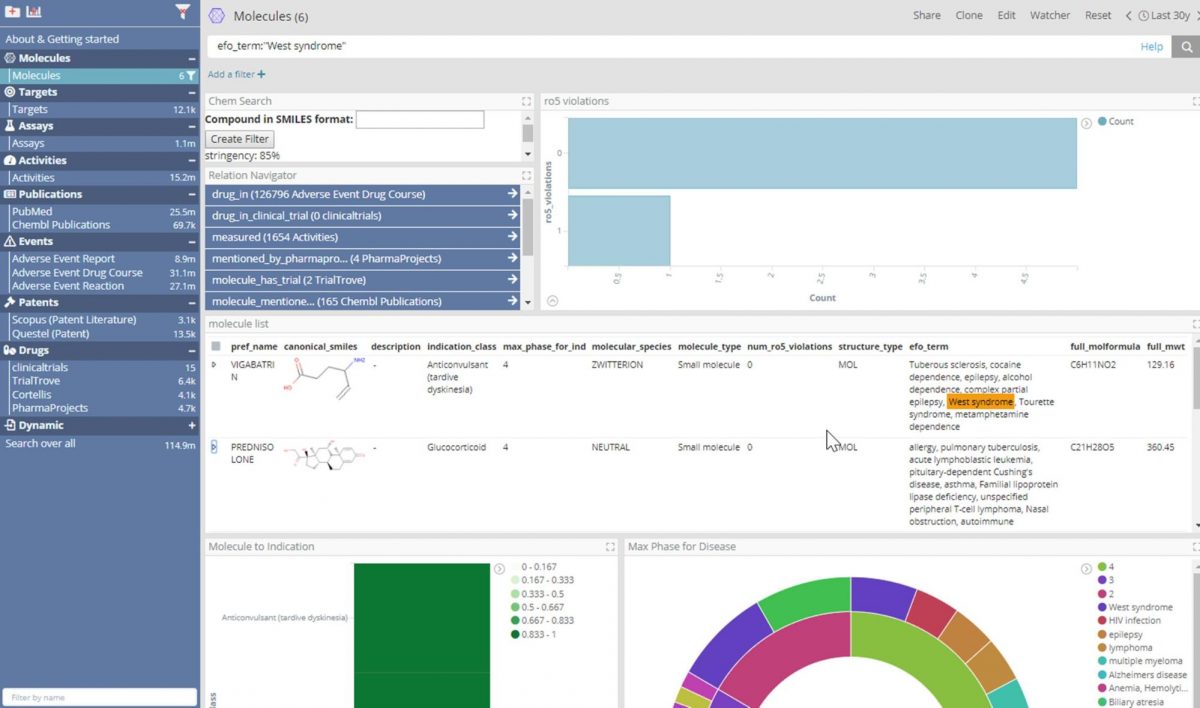
Thanks to enhancements to Elasticsearch and the use of data virtualization, thereby allowing connection to JDBC datasources (with no ETL), an investigator can have the interactive experience of an indexed search engine over a relational database containing ChEMBL. In the dashboard shown above, which part of our forthcoming life science deployment, the user can view, search and filter data for ChEMBL’s 1.8 million molecules as if the data was in an Elastic index.
In this example,“West syndrome” was searched for in the efo_term field, which derives from the ChEMBL Drug Indication table Experimental Factor Ontology term field.West syndrome is a constellation of symptoms characterized by epileptic/infantile spasms, hypsarrhythmia and intellectual disability. From this search we can see that six molecules are indicated for West syndrome according to ChEMBL.
Other data ingested into Elasticsearch indices includes 25 million Pubmed abstracts (tagged with genes, molecules and diseases), 8.9 million adverse event reports from FDA (FAERS) and some small-scale search results from various subscription services: TrialTrove, Cortellis, Scopus, Questel, Pharmaprojects, ClinicalTrials.gov.
In this demo deployment, by performing large scale joins across Elasticsearch indices and consuming data from multiple types of databases as if they were in fact an Elastic index, a life sciences professional can flexibly define relationships between entities, which can also be quickly reconfigured at any time. For example, by defining that the pref_name field in the ChEMBL Molecules index should be joined to the openfda.substance_name field in the Adverse Event index. This relationship has been named, and we have named that relationship ‘drug_in’ in one direction and ‘has_drug’ in the other.

Defining the significant relationships between entities enables the investigator to very quickly have a data model or the “knowledge graph”, which in turn allows the exploration of data by querying across the linked datasources based on the declared relationships.
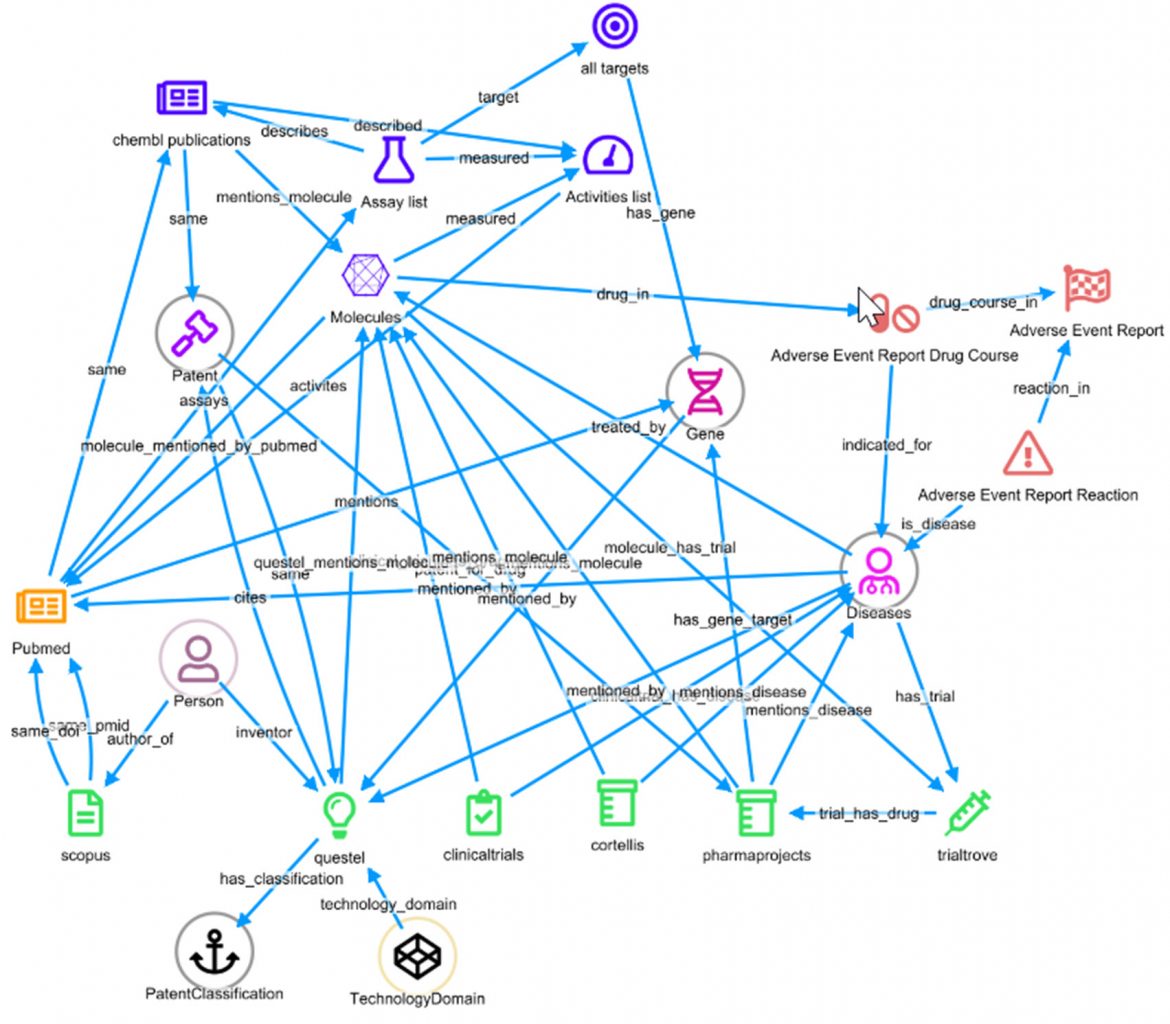
Having this underlying dynamic schema, and the inherent large joins across multiple data sources, enables dashboards to report the number of links to every other type of entity in the current selection.
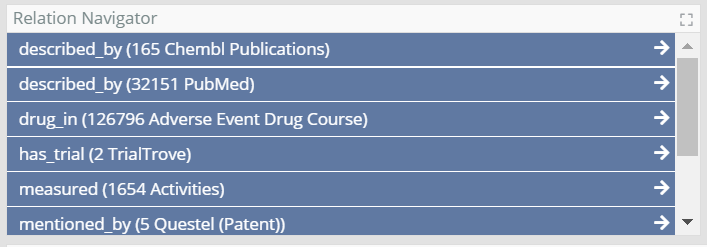
For example, the six molecules with West Syndrome are related to 126,796 Adverse Event Drug Courses, and we can navigate to that dashboard pre-filtered for those records by clicking its arrow. However, perhaps a more powerful way to explore the data is through the graph.
Explore the graph neighborhood of a disease-of-interest.
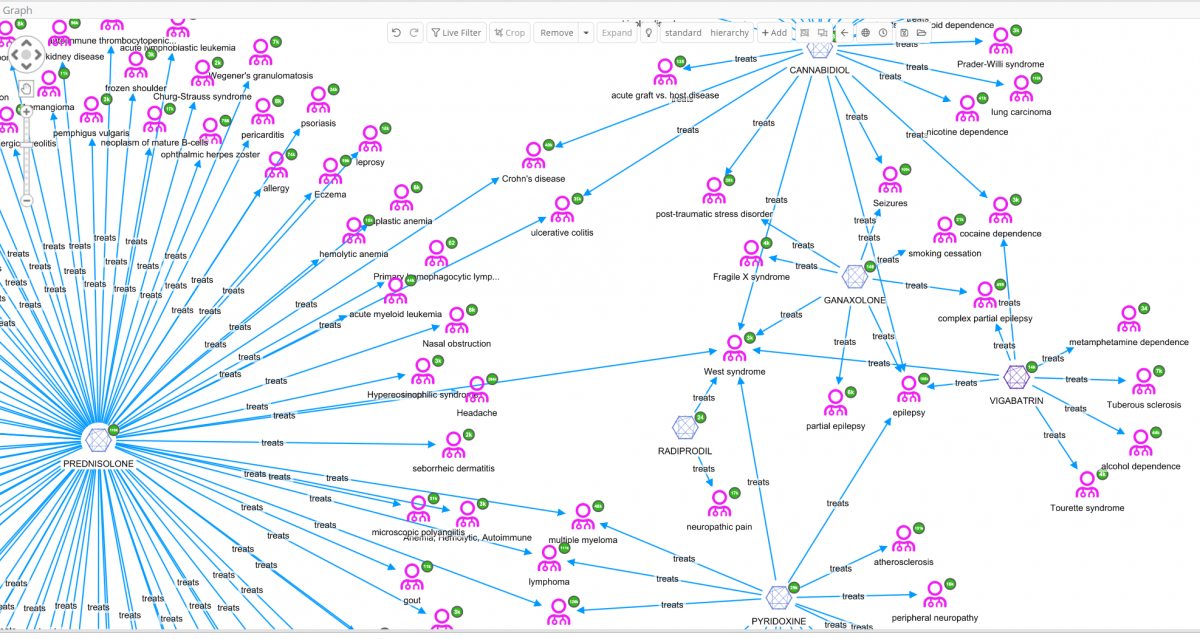
In the above graph visualization the six molecules connected to West Syndrome have been added, then expanded by the relation ‘treats’. Immediately, some very interesting details can be observed that would otherwise not be easy to identify just looking at data tables. A quick view of, not only on the diseases treated by the same drugs as used to treat West syndrome, but also details like diseases that share multiple drugs can be obtained.
The user can decide to further explore one of these diseases, e.g. Tourettes which is treated with VIGABATRIN according to ChEMBL. By selecting West syndrome, VIGABATRIN and Tourettes for further investigation [cropping of other nodes has been done to enhance the readability of the graph], and finally by expanding Tourettes by the relation ‘treated_by’, all molecules related to Tourettes appear.
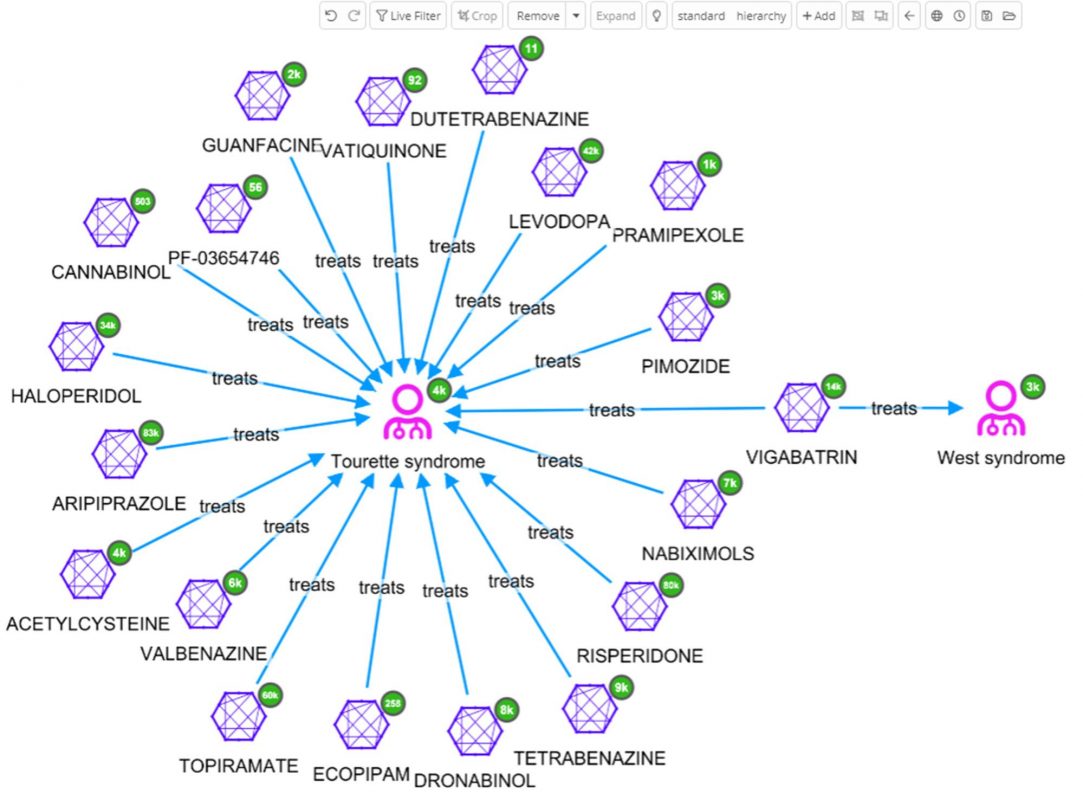
So far only one data source, ChEMBL, has been used. Perhaps, a similar outcome could have been accomplished by loading that data into many network visualization tools. The real power of the Siren Platform™ is to expand our network out to include a large data sets, with the power of large joins in the back end.
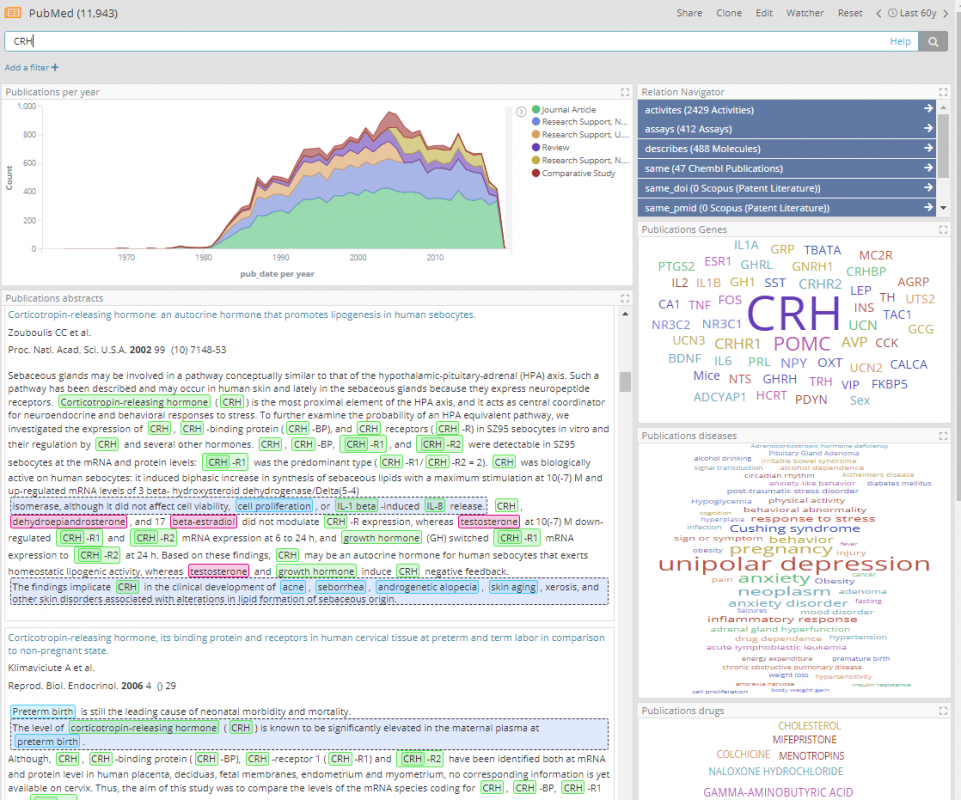
Aggregated relations to find co-mentioned genes.
Since many drugs act through their effects on genes and proteins, it might be useful to find which of these drugs are co-mentioned in literature with the same genes that West syndrome is co-mentioned with. One of the selected data sources is PubMed, which is tagged with genes, diseases and drugs. Now it is possible to expand the West syndrome node to see all its PubMed articles and then expand those for the genes they mention, then again to get other PubMed articles those genes are mentioned in, then again to get to join to the Tourettes compounds they mention. It’s easy to see how the graph will get overwhelmed with an explosion of nodes using this strategy. Instead, the aggregated relations feature in Siren can be used, to skip over the PubMed articles and just get all the genes that link to West syndrome via an article.
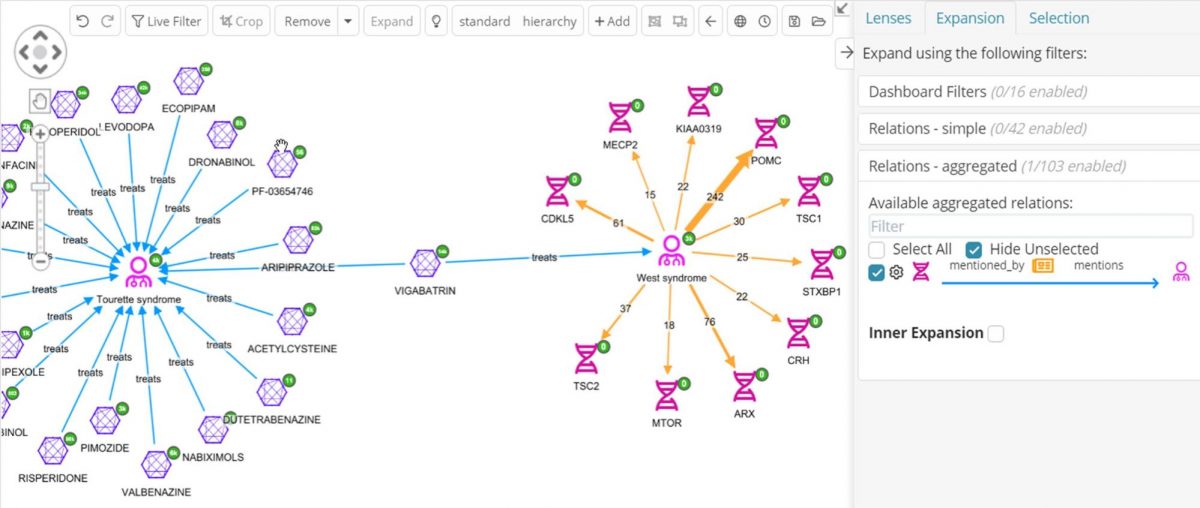
In the above graph the genes co-mentioned with West syndrome can now be clearly seen, together with how many articles are co-mentioning, for example, 22 articles are mentioning both West syndrome and the CRH gene. By default, only the top-ten most cited genes are expanded, but this is configurable.
Now the practitioner can perform the same type of join from the other direction, Molecule->Pubmed->Gene, but this time we will use an Inner Expansion, which will just add the relations between nodes already present on the graph.
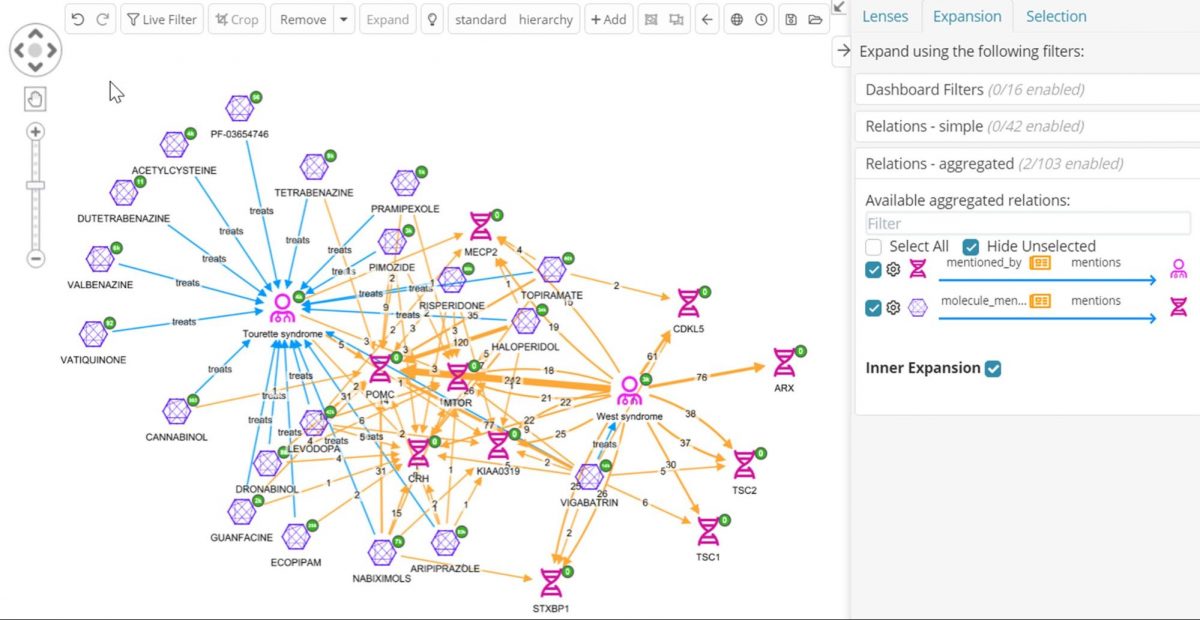
By doing this the operator gets a sense of which of the molecules indicated for Tourettes share the most West syndrome genes, and which molecules share genes with both diseases, helping us decide what to prioritize for further investigation. The ability to collapse nodes into relations across joins as shown above allows drug development professionals to replace long and complex workflows across multiple disparate sources with just a few clicks!
Insights from multiple relations types side-by-side.
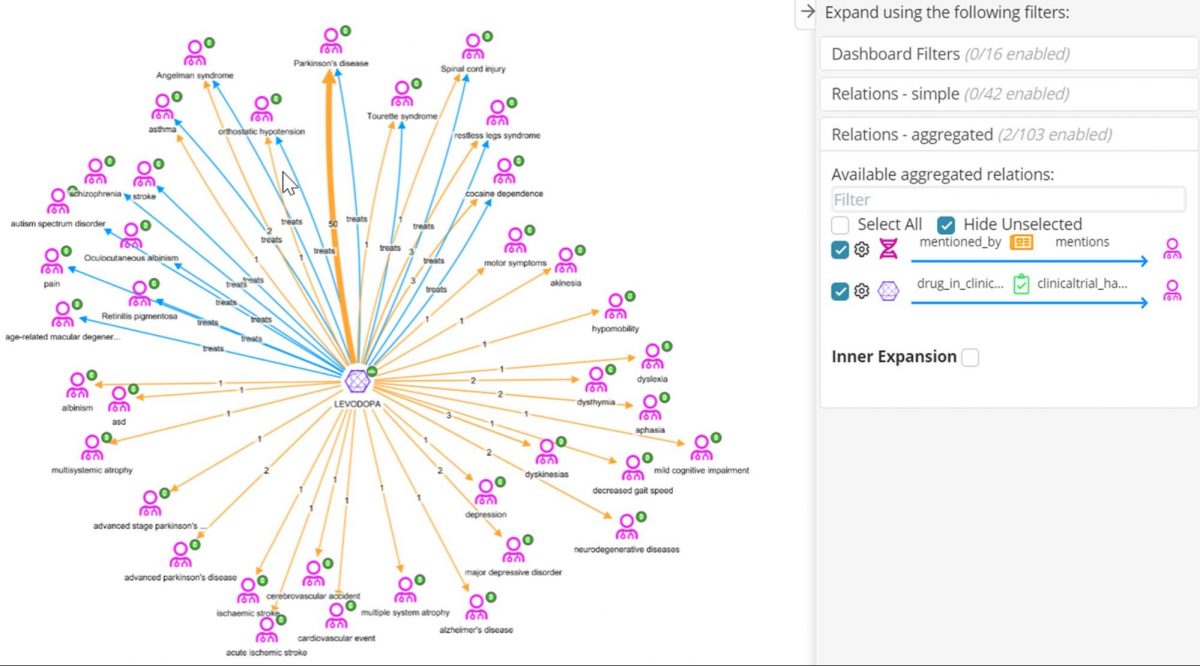
The molecule Levodopa looks interesting as it shares the most genes with Tourettes syndrome – maybe it is already a repositioning target. In the graph below, we have started with Levodopa, expanded it with the ‘treats’ relation (blue edges) to see the diseases it is indicated for according to ChEMBL. Then we have performed an aggregated expansion on Molecule-> Clinical Trial->Disease (orange edges), to see other diseases mentioned as the ‘Condition’ field in ClinicalTrials.gov. Those diseases with a blue and an orange edge are established indications of Levodopa which have a clinical trial; those with only an orange edge, e.g. depression, may represent new diseases that Levodopa is being investigated for repositioning. Those diseases with only a blue edge have no trials. This may be caused by differential naming of the disease, for example ‘autism spectrum disorder’ is the same as ‘asd’, or combination drugs mentioned in the clinical trial e.g. a trial for Retinitis pigmentosum exists but the mentioned drug is levodopa-carbidopa. Here, mapping disease and drugs to the same vocabularies used in ChEMBl would help to resolve these differences.
Conclusions
We’ve come a long way in just a few clicks, and all within one graphical interface. To summarize, by federating across data sources and defining links between them, traversing over a knowledge graph of all the data to explore it in various ways in one network, examining various molecules used to treat our disease of interest and finally focusing on drugs used to treat a disease it shares a treatment with, the practitioner can prioritize one of those drugs (Levodopa) for further investigation based on shared gene co-mentions.
In the following installment of this drug repurposing investigation use case, I will walk you through an investigation starting with a drug with potential for repurposing, and navigate through its adverse event knowledge graph to explore possible new therapeutic uses, and combined this with enterprise search to focus our search.


