
Drug repositioning investigation: Exploring the FAERs data set
A commonly employed investigative activity in drug repurposing, is to explore adverse event (AE) data connected to a drug-of-interest, which can often give clues for potential disease targets like drugs causing hypoglycemia could be potential candidates for diabetes.
In a previous post, I addressed how with Siren one can turn datasets such as drug-gene-disease-literature into a “virtual knowledge graph” which can be explored to gain insights into drug repurposing.
This time around, a new big data set – FDA Adverse Events (FAERs) – will be incorporated into the same dataset (for drug repositioning investigation workflows) to help highlight how the combination of BI style Analytics with Knowledge graph/link analysis are absolutely superior at tackling data fragmentation and provide insights.
But before we continue here is a disclaimer: the following examples are for illustrative purposes only and do not constitute medical advice.
Let’s explore!
Data on adverse events can be found in many places such as clinical trial reports, drug labels, even social media posts. For the present example we will explore the FDA Adverse Event Report (FAERS), AE reports that have been submitted to the FDA. In the current deployment, FAERS records have been ingested into indices representing three data types.
- Adverse Event Report: which gives details of the report meta-data including patient metrics. These records are joined to one or more
- Adverse Event Drug Course records: which detail the medicinal product and characterization or involvement in reactions (interacting, suspect, concomitant), and actions taken for the drug after the AE such as. ‘withdrawn’. This index has a join from its ‘openfda active compound’ field, to the ChEMBL Molecule index pref_name field.
- Adverse Event Reactions: The Reports are also joined to this third index, which have details of the AE term (MedDRA) and outcomes, e.g. recovered, fatal etc.
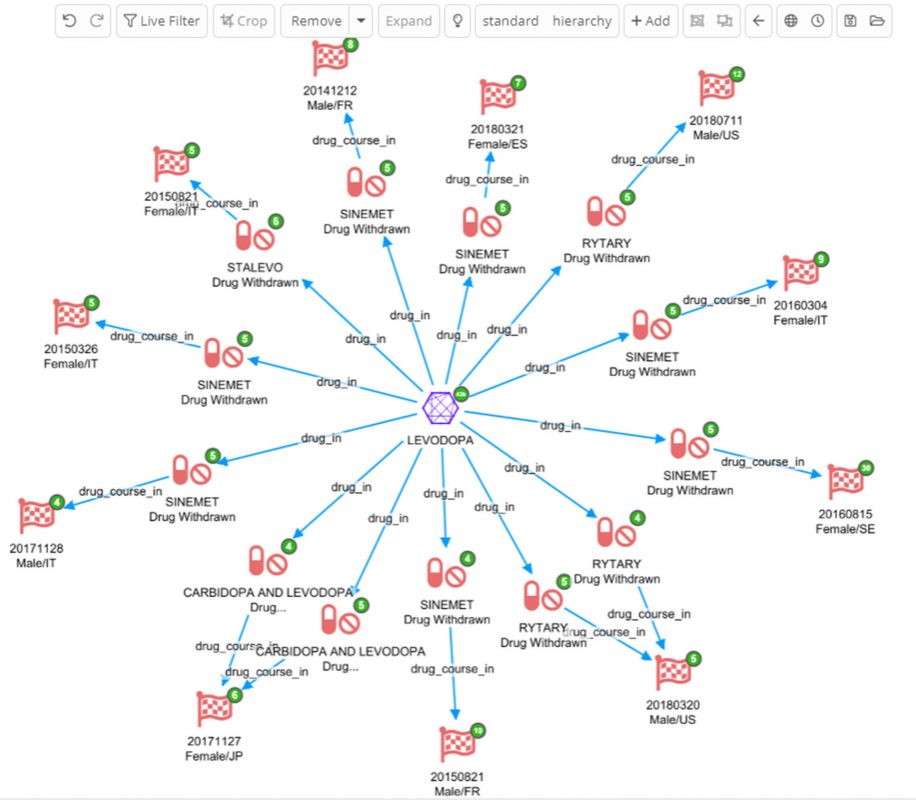
In the previous post we used Levodopa as our example drug of interest – let’s now explore its AE landscape. The dashboard below was the result of the following few steps in our Siren environment for drug repurposing research:
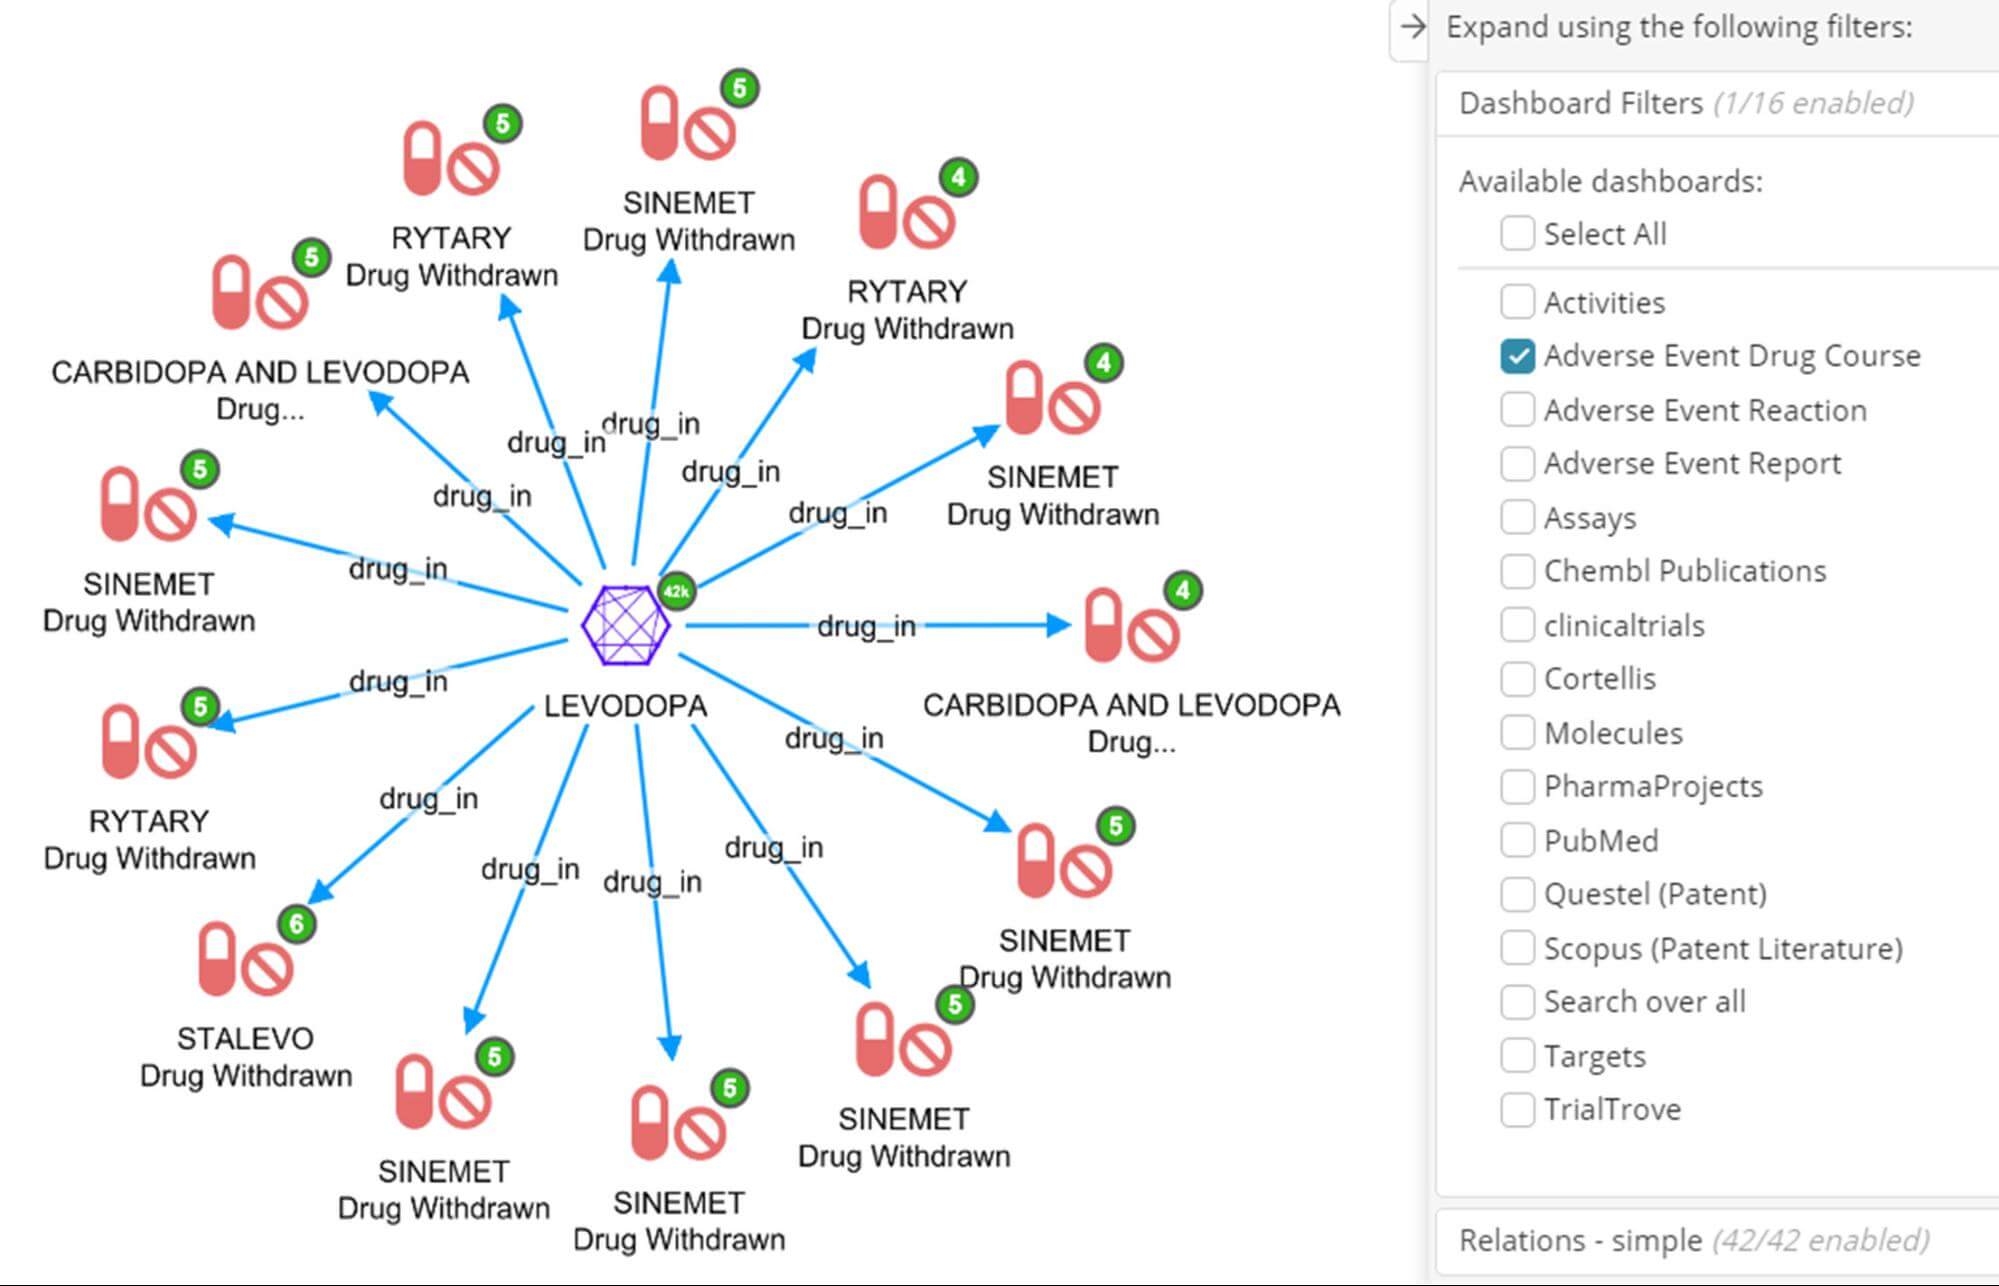
- Filter the Molecules dashboard for Levodopa.
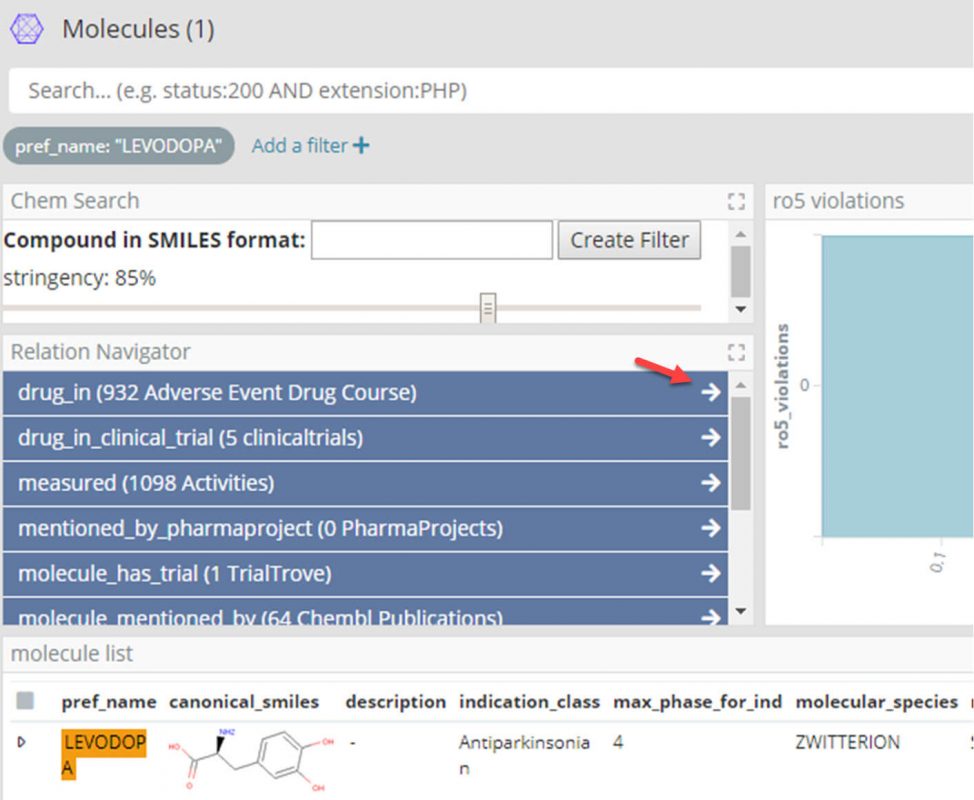
- We can now use the Siren Relational Navigator (the blue buttons with the white arrows in the screenshot above) to move to the Adverse Event Drug Course dashboard by following the ‘drug_in’ relation, which will be pre-filtered for only those drug courses with Levodopa.
- At this point filter the Adverse Event Drug Course dashboard further for ‘Suspect’ and ‘Withdrawn’ drugs, taken for Parkinson’s.
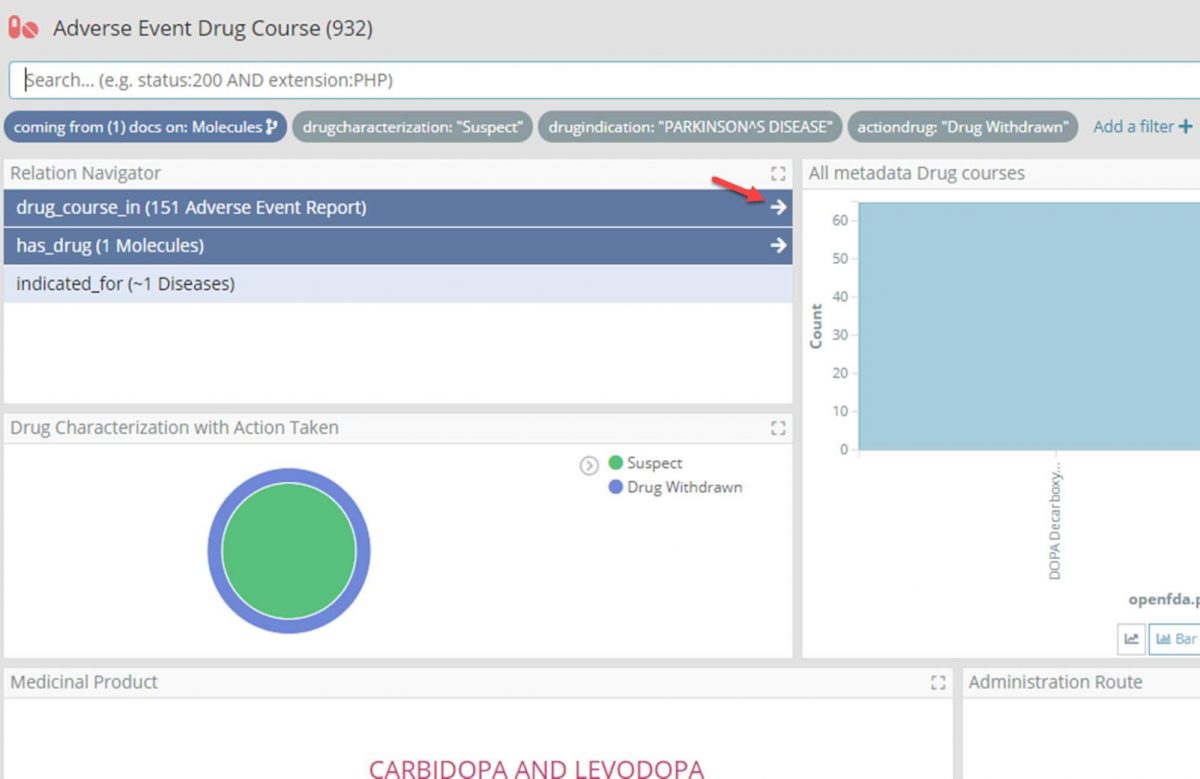
- Again using the Relational Navigator, move through to the Adverse Event Report dashboard by following the ‘drug_course_in’ relation which will be pre-filtered for only those reports with one of the drug courses.
- Filter the Adverse Event Report dashboard for reports marked as ‘Serious’, and change the time filter for only those reports for the last two years.
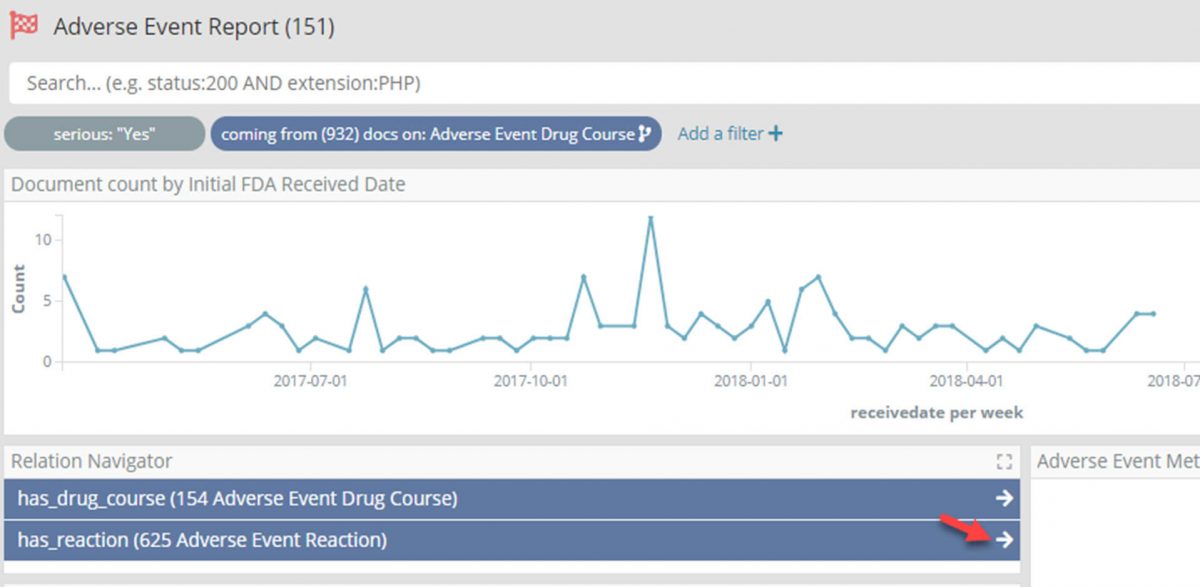
- Again using the Relational Navigator move through to the Adverse Event Reaction dashboard by following the ‘drug_course_in’ relation which will now be pre-filtered for only those reactions in one of the filtered reports.
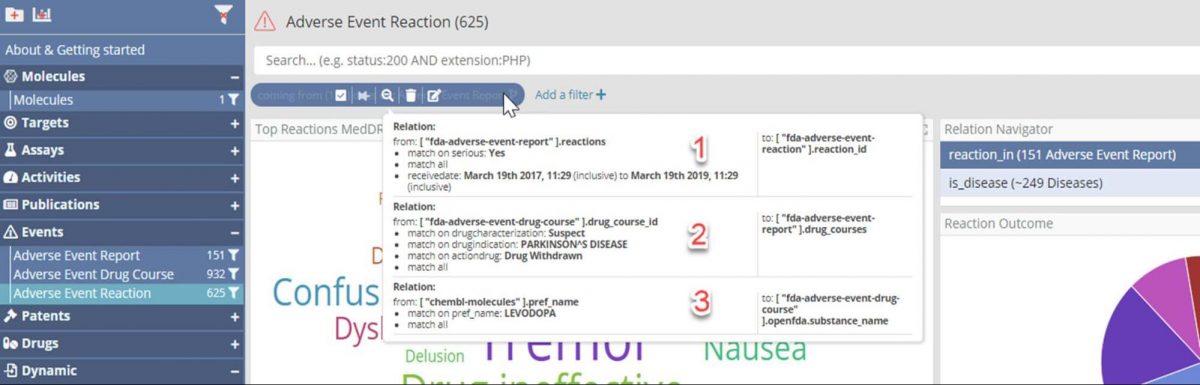
Having drilled down through four large data sets to focus on the 625 Adverse Event Reactions which are:
- In a report marked as ‘Serious’ in the last two years,
- Where the report indicates the patient was taking a drug course for Parkinson’s, suspected of causing a reaction and was withdrawn, and
- Where the drug taken was Levodopa.
By leveraging link analysis, an investigator can now ask questions such as which types of reaction are most commonly associated with Levodopa:
- Add the 625 reactions to the graph.
- Expand by the ‘is_disease’ relation to group the reaction records found in reports by their reported reaction (MedDRA PT).
- Select only those disease nodes with 8 or more edges, and their reaction partners, and crop the rest
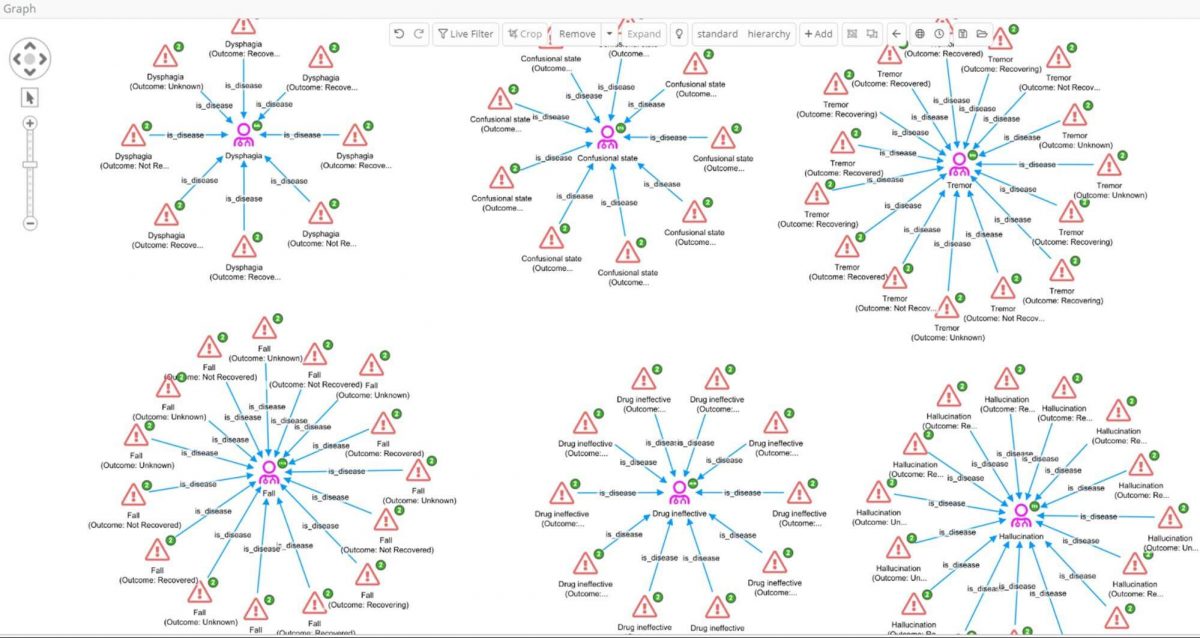
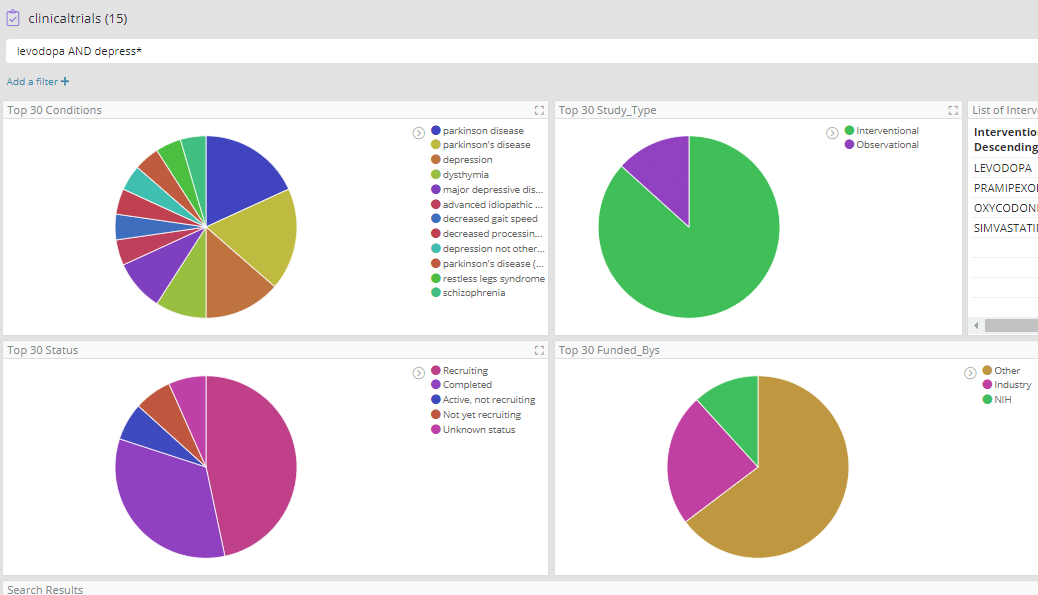
Most of these high-frequency reactions would perhaps be expected in Parkinson’s patients where ‘Drug ineffective’ is also reported. However, among these we find ‘hallucination’, which could potentially be of interest as drugs that cause hallucinations are emerging as having potential in treating depression. In fact hallucination is a well-known side effect of Levodopa, and we have previously seen evidence in our data for its repurposing in depression in clinicaltrials.gov which records several trials.
Exploring Drug Interactions
Another indicator used to highlight targets for drug repositioning, is its interactions with other medication.
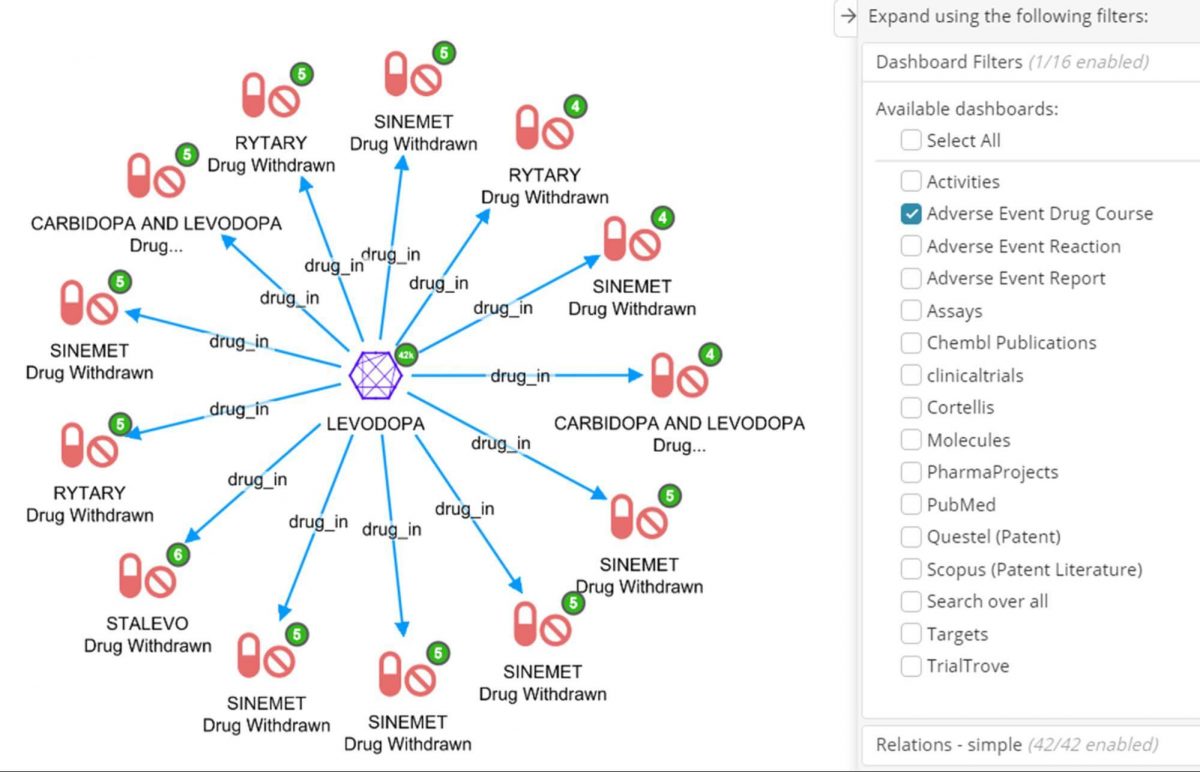
In our example, these targets can be highlighted by filtering Adverse Event Drug Course dashboard for drugs that have been characterized as ‘interacting’ and the subsequent action taken was ‘Drug Withdrawn’; and then further explore results with link analysis.
First step is to start from the Levodopa node to see any Adverse Event Drug Courses it is mentioned in, and using the dashboard filter for Adverse Event Drug Course, such that only interacting/withdrawn records connected to Levodopa are added to the graph.
Another indicator of targets for drug repositioning is a drug’s interactions with other drugs. Below is an Adverse Event Drug Course dashboard filtered for those where the drug was characterized as ‘Interacting’ and the action taken was ‘Drug Withdrawn’
Secondly, expand by drug_course_in to see the Adverse Event Reports those drugs were taken in. The node labels also show the report date, patient sex and country code of the report.
Thirdly, expand on the Adverse Event Reports on ‘has_drug_course’, the other drug courses taken by the patient come to light.
Finally, expanding on ‘has_drug’ joins back to ChEMBl to see all the compound records for those drugs.
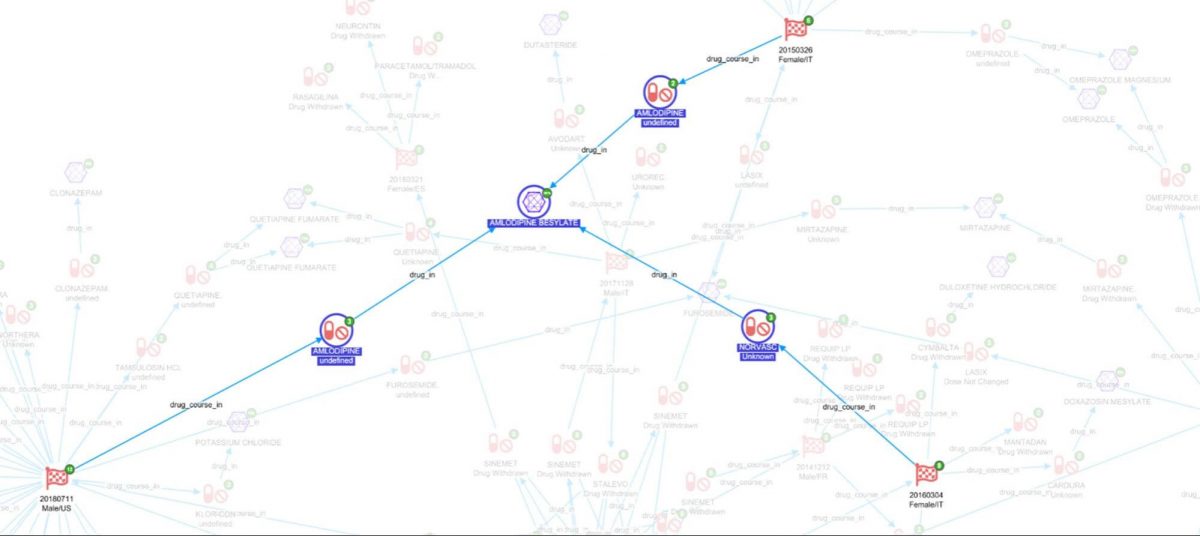
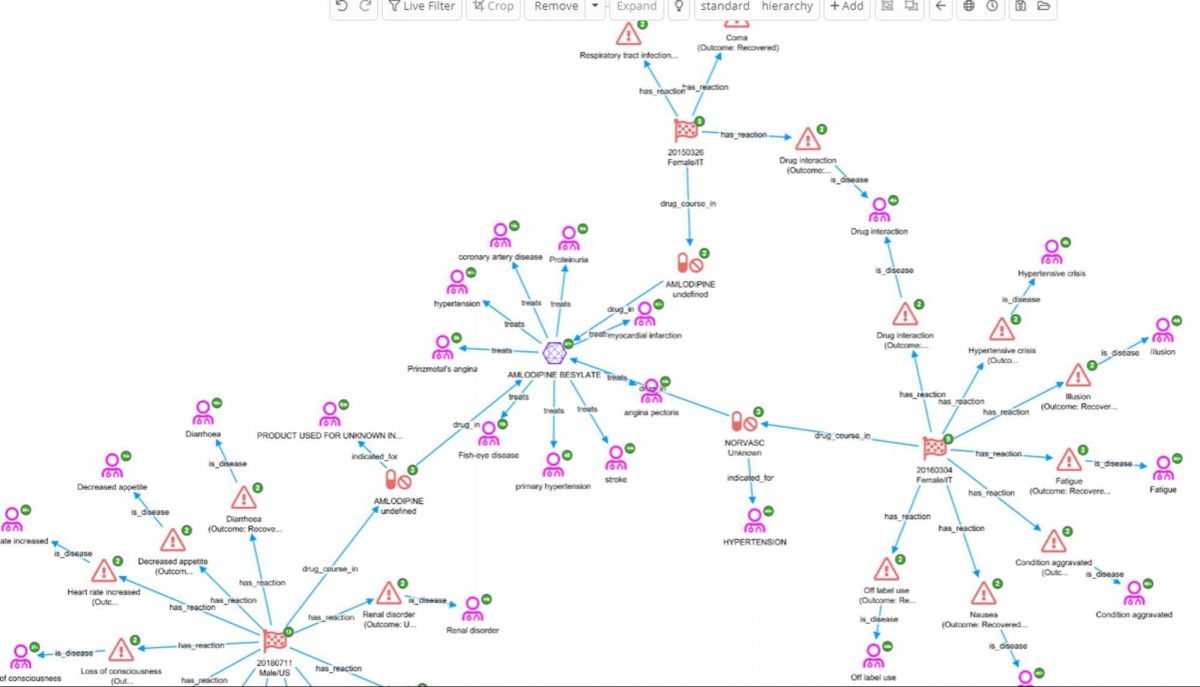
In the above screenshot we can see there are three reports where AMLODOPINE BESYLATE was taken in the same patient where levodopa was said to be interacting. It is now possible to look at what reactions it is associated with (FAERs), what it was being used to treat(FAERS), and diseases it is usually indicated for (ChEMBL).
Amlodipine is used to treat, among other things, hypertension. In fact, if we check for interactions between these two drugs on the Medscape drug interaction checker it is reported that “levodopa increases effects of amlodipine by pharmacodynamic synergism. Use Caution/Monitor. Consider decreasing dosage of antihypertensive agent.”
Combining knowledge graphs and enterprise search to explore adverse events
The easiest way to further explore Levodopa and hypertension is to perform an enterprise search over all documents, using a dashboard created from a ‘*’ index pattern. For this particular example we have used wildcard search to include any documents that mention Levodopa and hypertensive or hypertension or blood pressure, and limit the search to trial-related documents with the ‘randomized’ keyword.
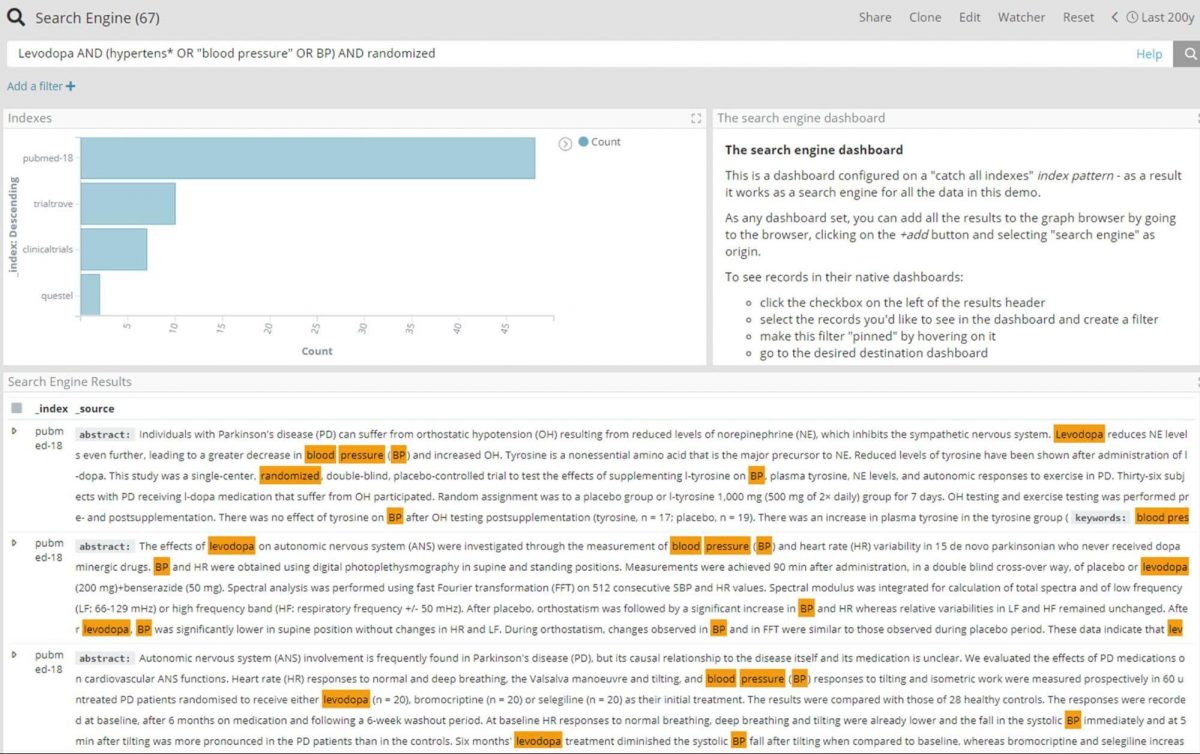
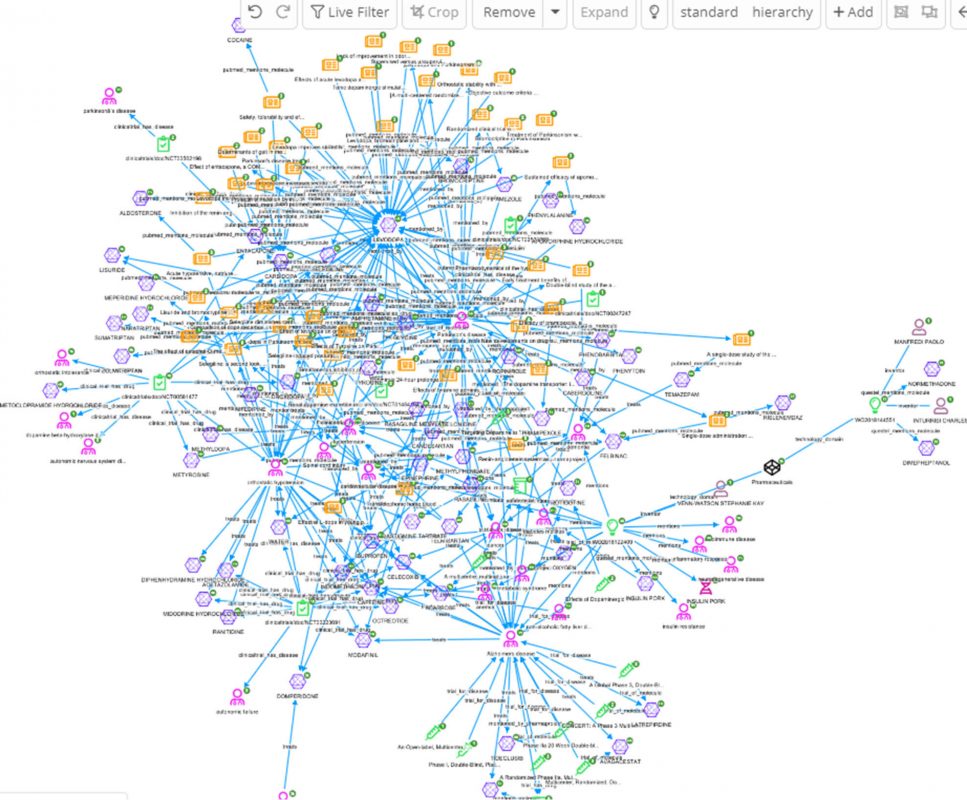
A better view of the connection around the above shown results can be achieved by adding the 67 entities to the graph, and expanding the nodes on all relations for further exploration.
Conclusions
This blog posts has aimed to demonstrate how biomedical research into drug repositioning can see great benefits by levering technologies such as Siren’s. Firstly, to identify drugs with potential for repurposing; secondly, to navigate through its adverse event knowledge graph to explore possible new therapeutic uses; and finally use enterprise search to focus the search even more.
Drug repurposing or re-positioning has been used as an example of one type of investigation where the combination of enterprise search, link analysis and a virtualized knowledge graph has the potential to accelerate investigation of biomedical data, finding the most promising leads, versus sequential querying of multiple large data sources. Others use cases that leverage the sames principles include competitive intelligence, patent exploration, pharmacovigilance, some of which we will explore in future blog posts


