
We’re very excited to announce the availability of Siren 10.1, the latest iteration of the leading Investigative Intelligence platform that is used by some of the world’s largest and most complex organizations to derive business value adding insights from their data. This new version ships with dozens of core upgrades, new high impact features and improvements that as a whole fundamentally enhances how ‘citizen data scientists’ approach their every day to day investigative processes.
The citizen data scientists, users who create or generate models that leverage analytics platforms but whose primary job function lies outside of the field of statistics and analytics, will particularly derive great value from the new functionalities which enable them to further leverage their data within the context of their particular organizations. The following are the standout highlights of the Siren 10.1 release:
Siren Investigate
- Graph browser: Grouping on nodes, graph metrics lens, heat map mode, aggregate relations
- Relational model: Improved with nested searches directly shown in the data model.
- Keyboard shortcuts and CSV imports/exports.
- Management: Improvements to data model and saved searches.
- Time filter: Improved creation.
Siren Alert
- Alert wizard and templates: Automatic relationships, index figerprinting and context sensitive templates
- Visual wizard: Threshold alert creations.
- Watcher creation: Directly from the Siren Investigate user interface.
Siren Federate
- Oracle: improved performance.
- New JDBC drivers: Google BigQuery and Denodo support.
Siren Platform
- Elasticsearch 6.3 compatibility.
- Full stack support for ELK built into the Siren subscription
- Performance: Improvements, including job cancellations and job throttling.
- Access Management Control: GDPR compliance
Now for a deeper look dive into each constituent part of the release
Frontend – Link analysis
Plenty of new core features in Link analysis.
Grouping on nodes (combo nodes)
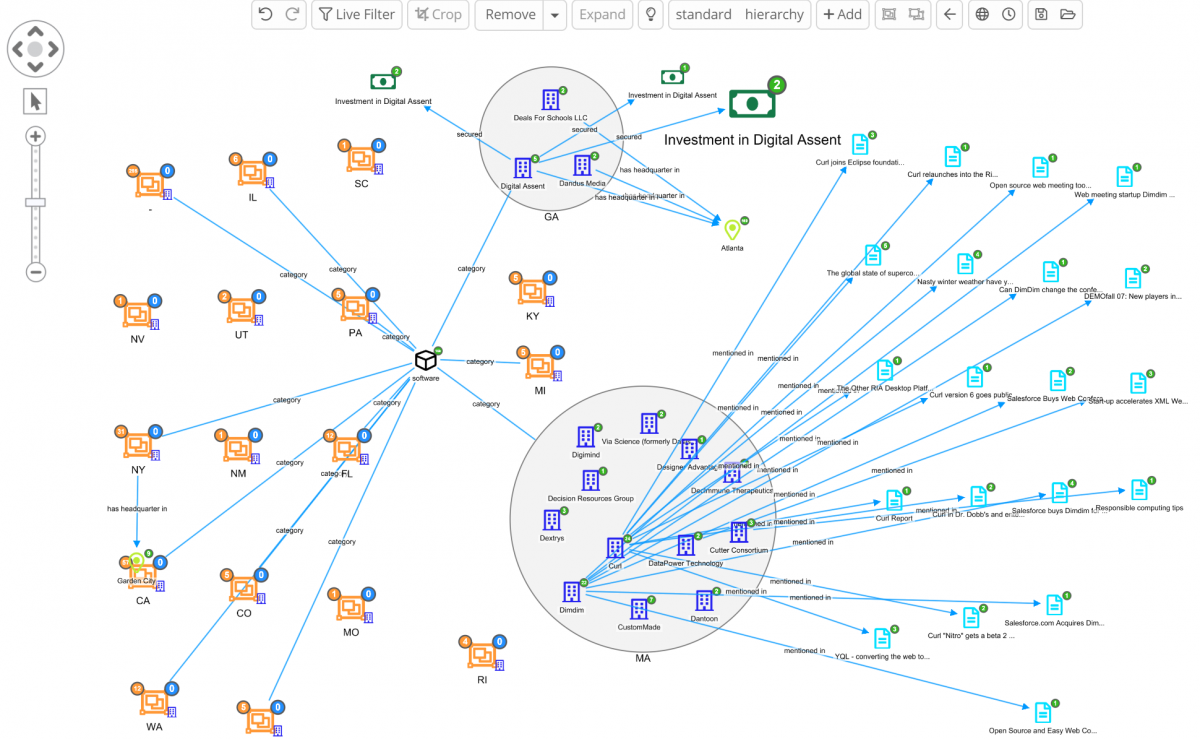
Siren now allows grouping nodes by manual selection or automatically based on shared properties (e.g. all records located in “France” or “Germany”, “all IPs in server room A”, “all patients from the placebo clinical trial arm”, etc.). This ability can reduce graph clutter and make important patterns visually emerge, with clusters then able to be “peaked into” during analysis (or decluster as required).
Below you can see an example taken from our classic demo, where companies are clustered by the US state where their headquarters are listed as being addressed in.
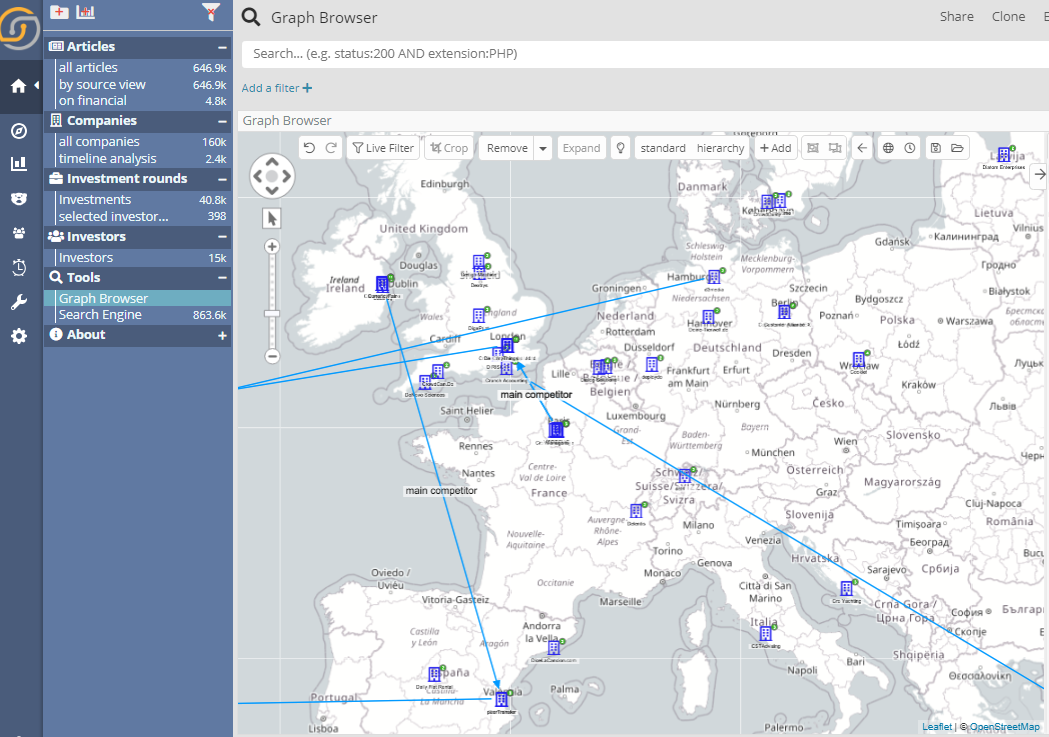
Map heatmap mode
An extra click on the map icon will now allow the user to pivot from the “individual entity” mode to an aggregate heatmap. This is great to overcome the effect of projecting “pins” on a map. For example, looking at the following map one might think this startup group is pretty much evenly distributed across Europe.
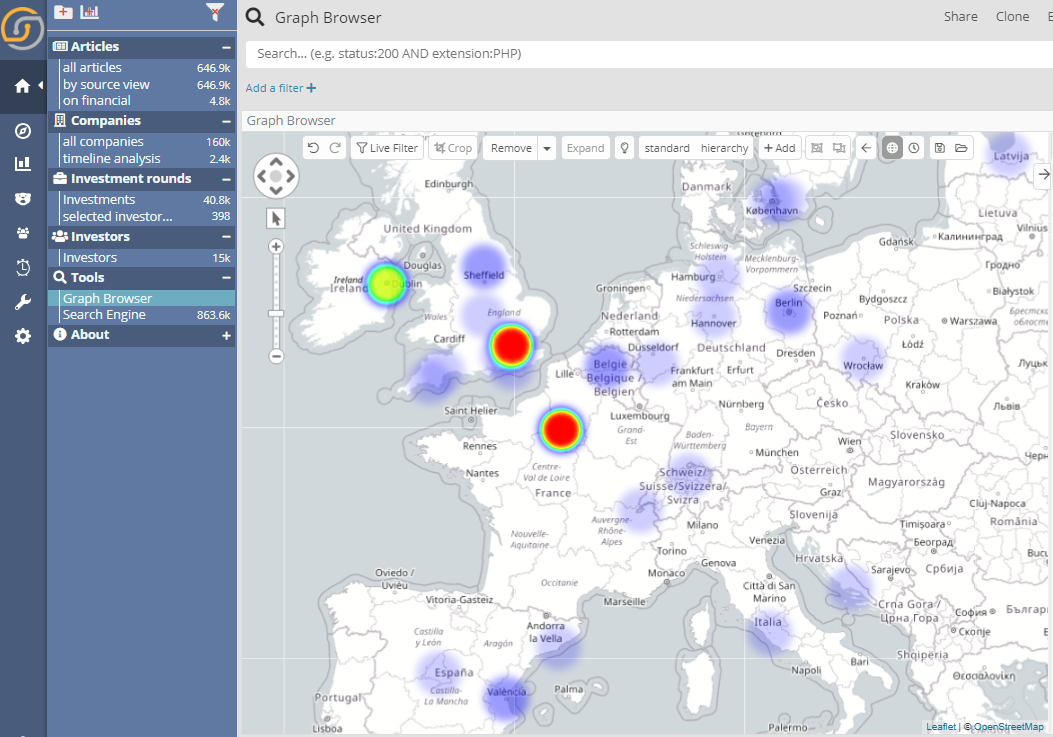
The reality though is quite different, as the heatmap mode reveals.
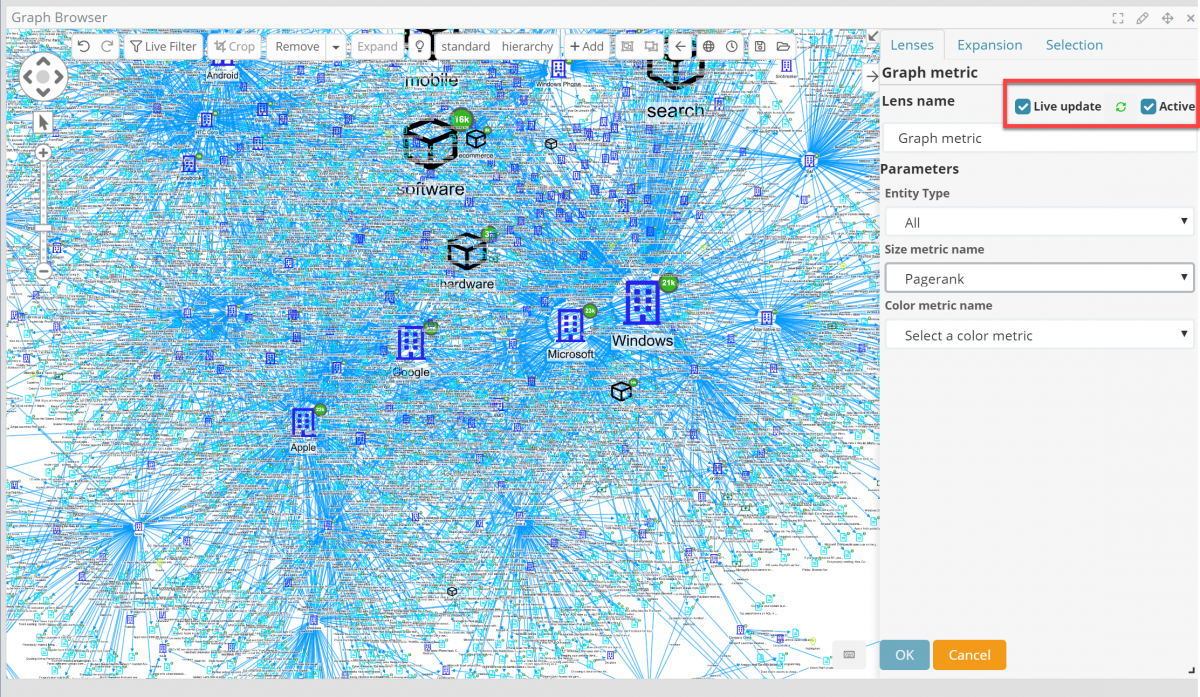
Graph metrics lens
Graph metrics such as Connectiveness, Degrees, Closeness, Betweenness, Eigenvector as well as color coded clustering are well known tools for link analysis investigators and are now available in the graph via the new “graph metric lens”.
When dealing with thousands or even more nodes, it is not always clear which of them are more connected or relevant – in terms of connectivity – than others. By turning on the graph metric lens certain nodes now visually stand out based on their overall role in the graph.
As an example, here is a rather tangled graph with thousands of nodes and tens of thousands of relationships.
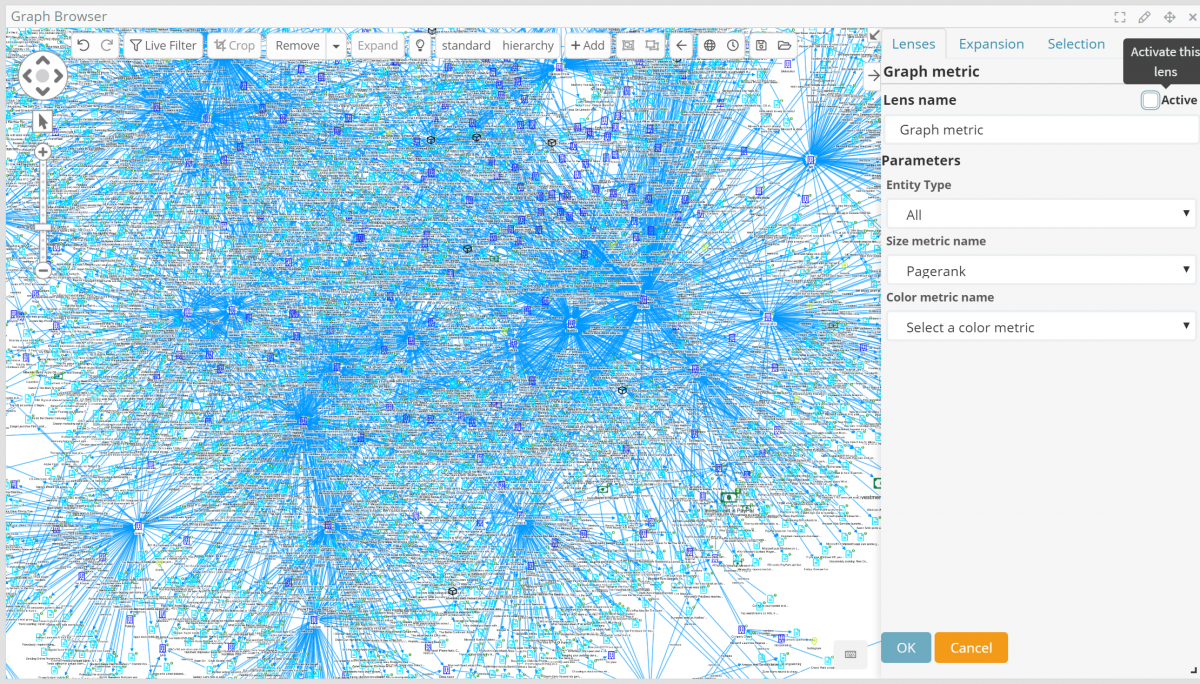
By enabling Pagerank, one of the graph metrics, the central nodes emerge clearly.
Sidebar “Expansion” tab – and Aggregate Relations
A new tab has been added to the graph sidebar dedicated to controlling how nodes expand – the operation that takes place when one manually double -clicks a node or selects a group of nodes and select the “expand” button-.
There are 3 subsections in this tab:
Dashboard filters
Any new node produced by an expansion must also be present in the selected dashboard. This is a powerful way to restrict expansions based on the power and flexibility of the dashboard filters.
Active relation filter
Choose which relations to expand on. By default, expanding a node shows all the relations. It is often the case however that only some are interesting in some specific phase of the investigation (or as a graph present). In Siren 10.1 one can quickly select what should be expanded next.
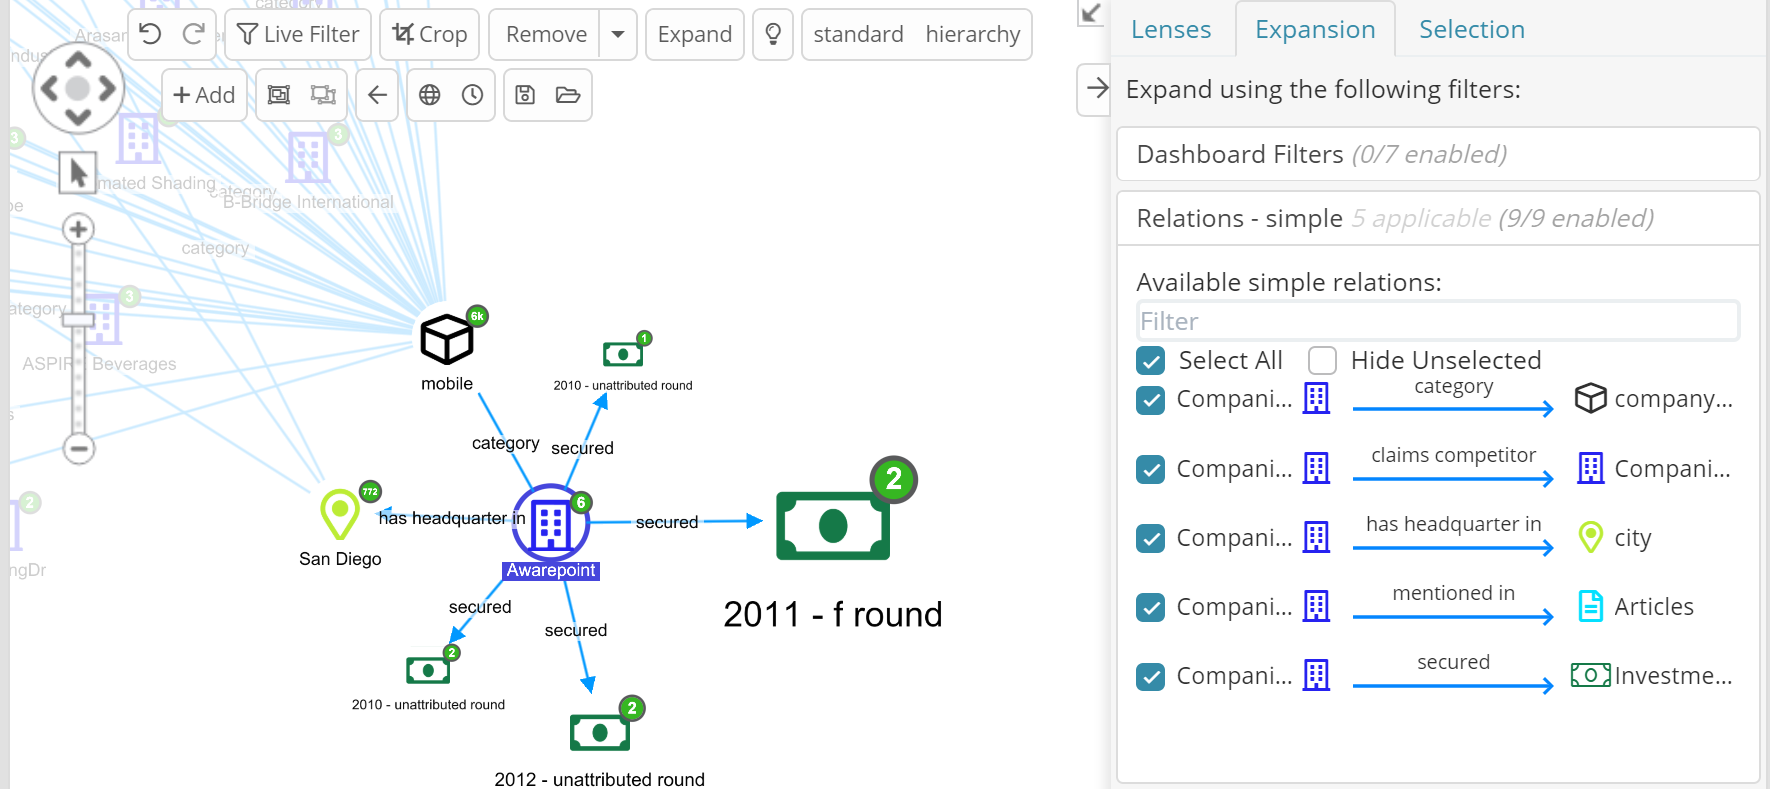
Worthwhile noting that upon expansion, the numbers on the nodes (node connection number) will change to reflect the connections which use just the selected relations.
Big data aggregate relations (patent pending)
The graph browser can now show aggregates on graph edges which instantly summarize groups of intermediate nodes pushing down big data computations (counts and metrics) to the native backend system, whichever that may be.
As a quick example, in our demo data there are 1709 “article” nodes that connect Google and Microsoft (effectively “co-mentions”). Turn on the right “Aggregated relations” and this is how it looks.
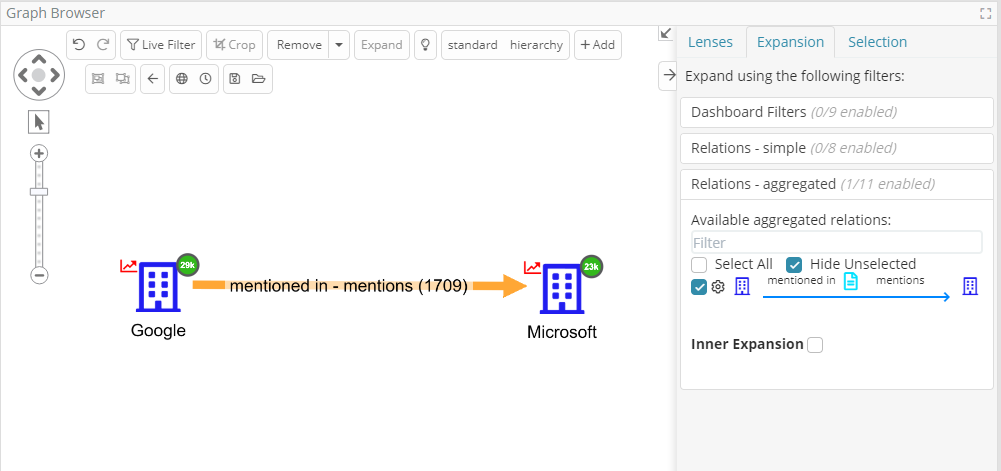
Thanks to the use of the backend aggregation functionalities, aggregate relations are returned extremely fast (often as fast as open normal relationships) even when millions or billions of nodes are grouped.
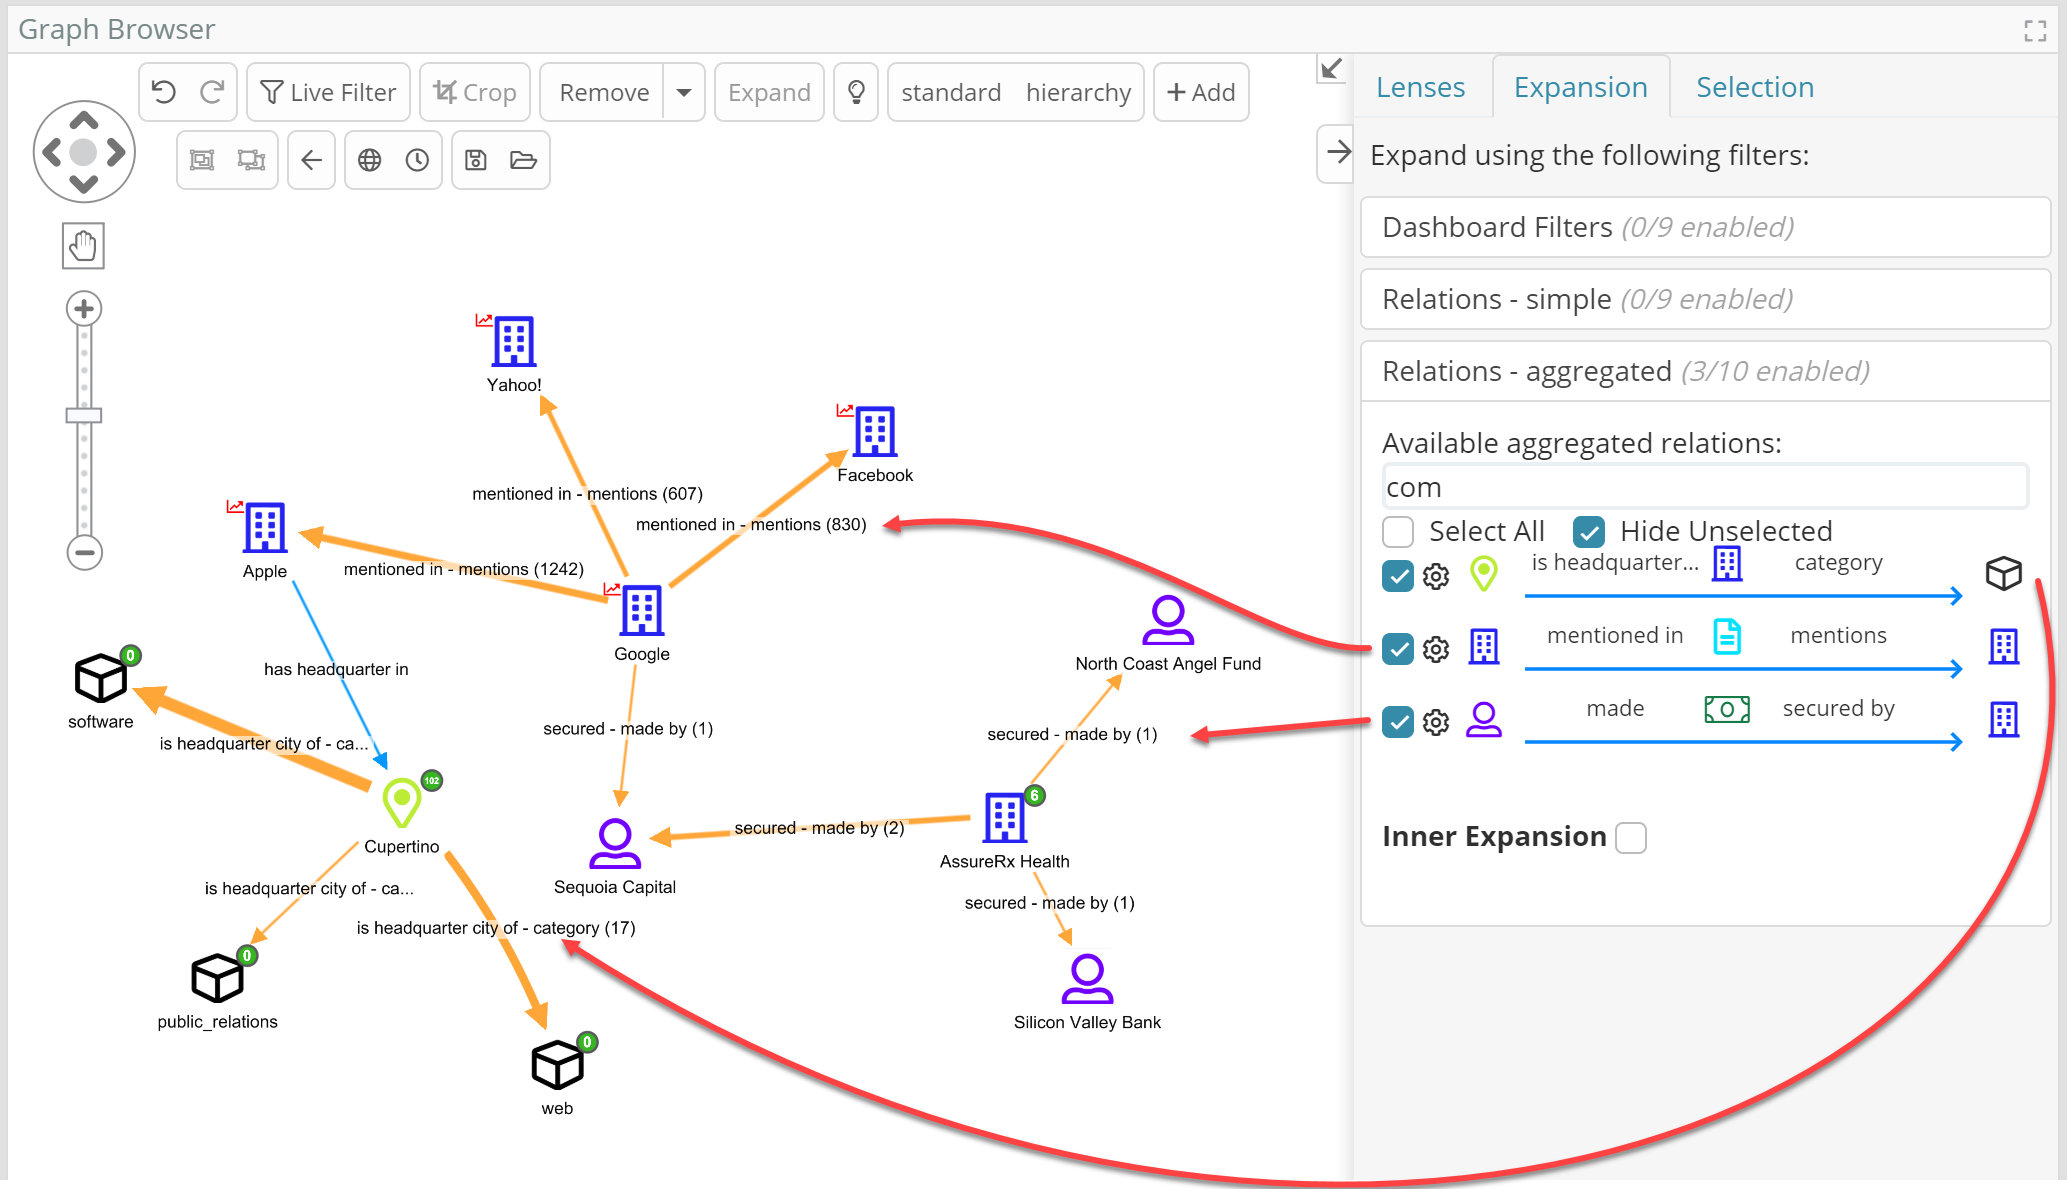
Aggregate relations are activated in the “expansion” tab of the graph side panel, coherently with how one activates regular relations. But while regular relations go directly from one entity to another, aggregate relations “skip one” in the middle.
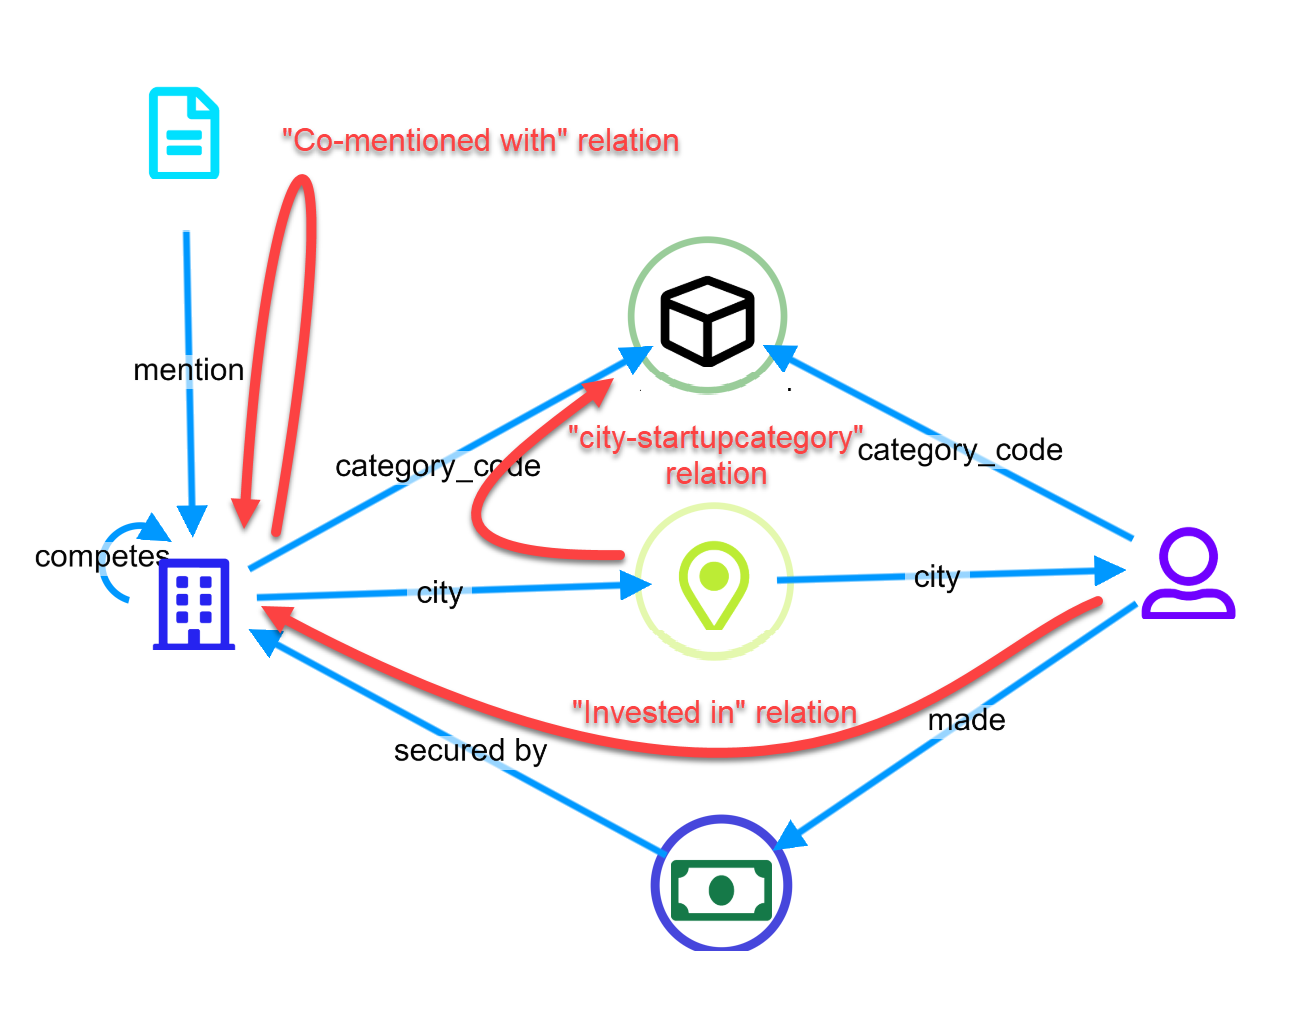
As an example, the following is our classic demo ontology, composed by 7 relations.
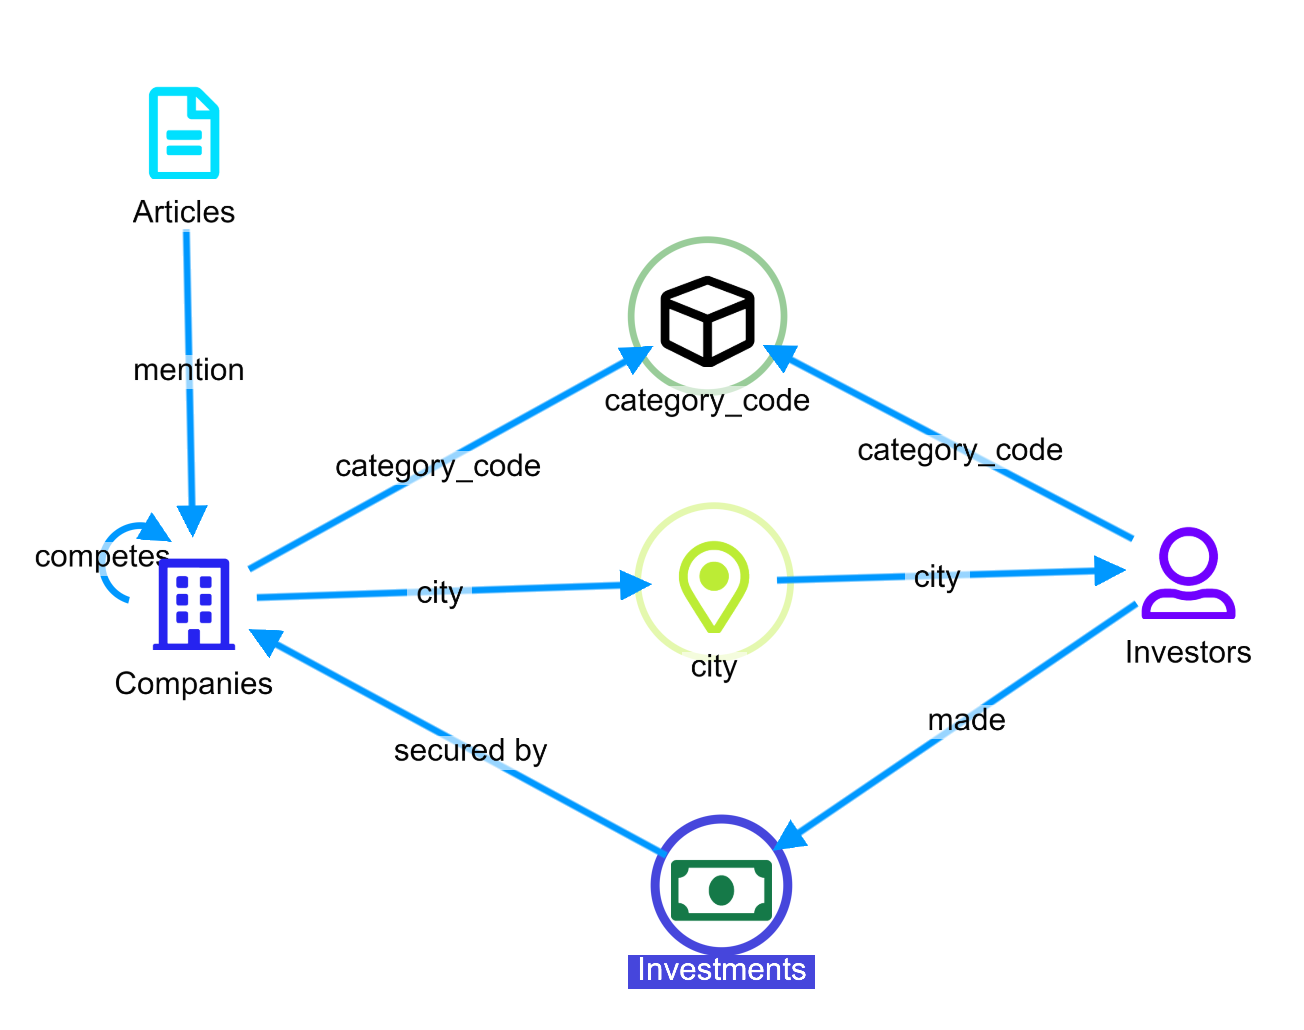
There are many complex relations, but some worth highlighting are:
- Company –> Investment –> Investors – How many investments went from an investor to a company?
- City –> Company –> Categories – How many companies are in a city per category?
- Companies –> Articles –> Companies – How many articles co-mention the 2 companies?
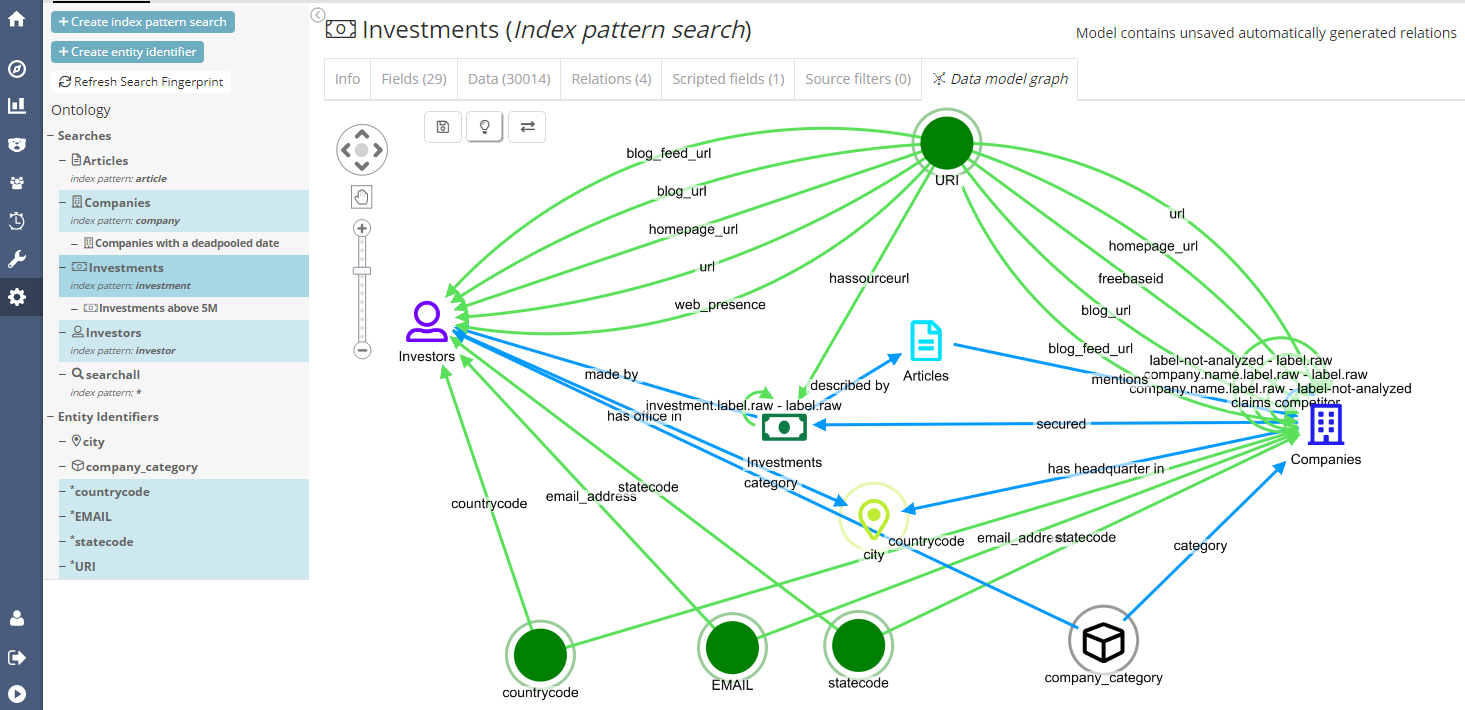
On the schema, these are the relations.
and this is how they can be activated from the side panel now (complex relationships are otherwise switched off by default).
A user might wonder if all the “skip an entity” relations make sense and or can they be all computed efficiently by the backend?
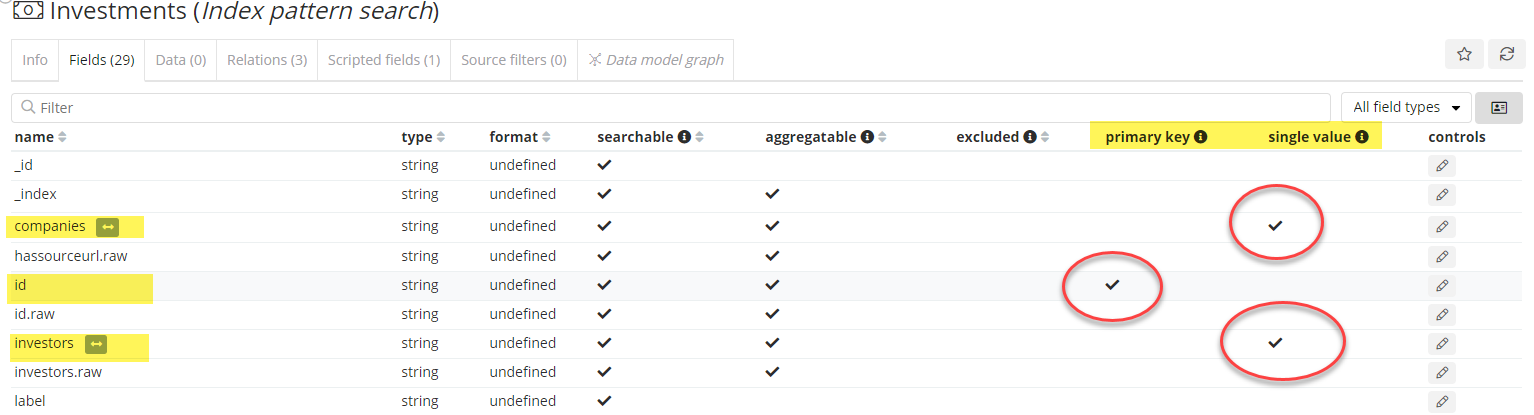
The answer is no. For example, the field used to annotate which company is mentioned in an article only contained 1 value (this is the norm on a SQL backend). In this “single value field” case the concept of “co-mention” wouldn’t make sense, as two companies would appear in the same article.
For this very reason the Siren Platform allows a user to mark a field as “single value” as well as identify “primary keys” in the data. Setting these properties will eliminate from the user interface the relations that don’t make sense or cannot be computed by the backend.
Others: Keyboard shortcuts, table CSV exports
Many functionalities are now accessible via the keyboard, the most wanted of which being scroll, zoom, and the pan to selection transition via Ctrl. CSV exports are now also available as a graph data inspector table functionality.
Visualizations and controls
Input controls
The Siren Multichart has been so far quite a popular way for users to browse all the possible metadata associated to an index and visually filter down with the most appropriate analytic widget. In the following example from our classic demo metadata from a particular investment is selected with the widget subsenquently changing to allow selection of values from that field.
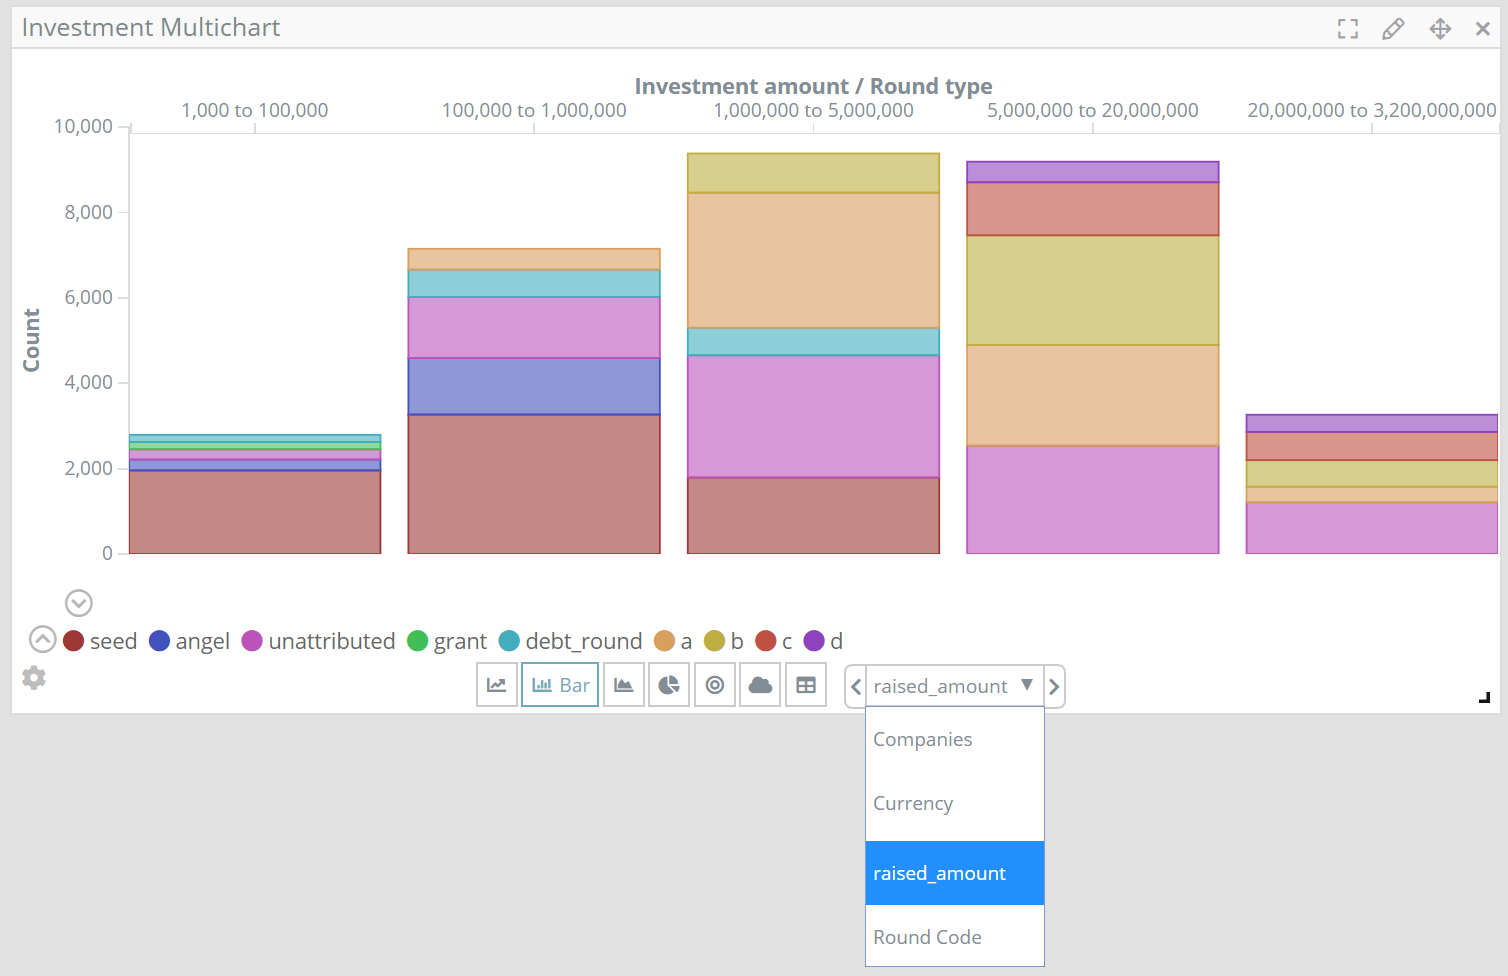
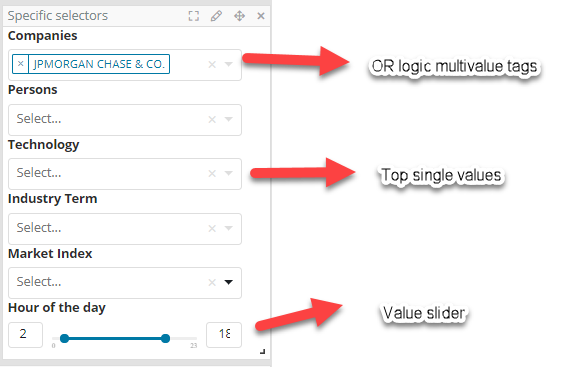
While this is useful in an array of situations, there are others in which the priority is to immediately see the most important metadata fields and quickly cycle through values. For these cases Siren Investigate now implements Kibana 6.x style Input Controls, that allow quick selection of the top values (with either single value, or multi-value “tags” mode) as well as value ranges.
As input controls do not inherit the current dashboard filters, they always will list all the possible values allowing for quick cycling.
“Others” and “Missing” slices in aggregations
Options to show slices related to “other” buckets or “missing values” are now available in every widget where term aggregation is available.
Selection of multiple filters in OR mode
Should a user want to have news articles from just a few selected countries chosen from a map (or any other control in Siren)? This is now possible by simple performing ‘CTRL+CLICK’ to create an ‘OR’ filter.
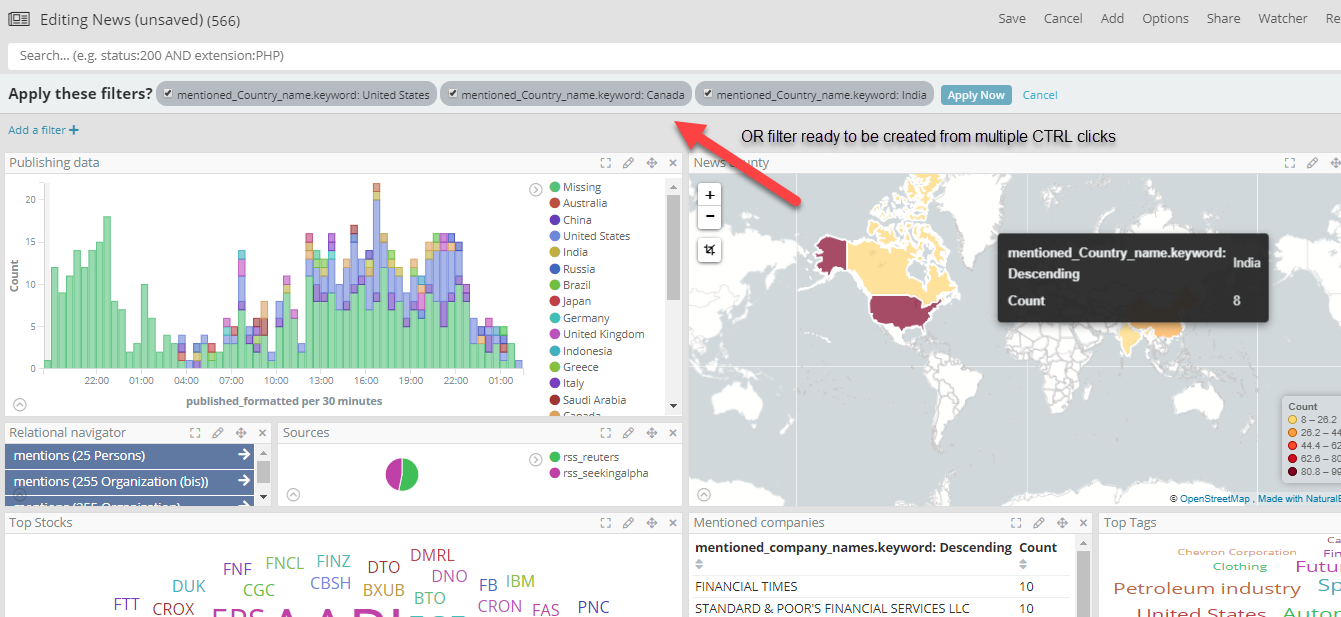
Filtered buckets are also collected when coming from multiple controls (E.g. one can click on a map and on slices of the pie chart).
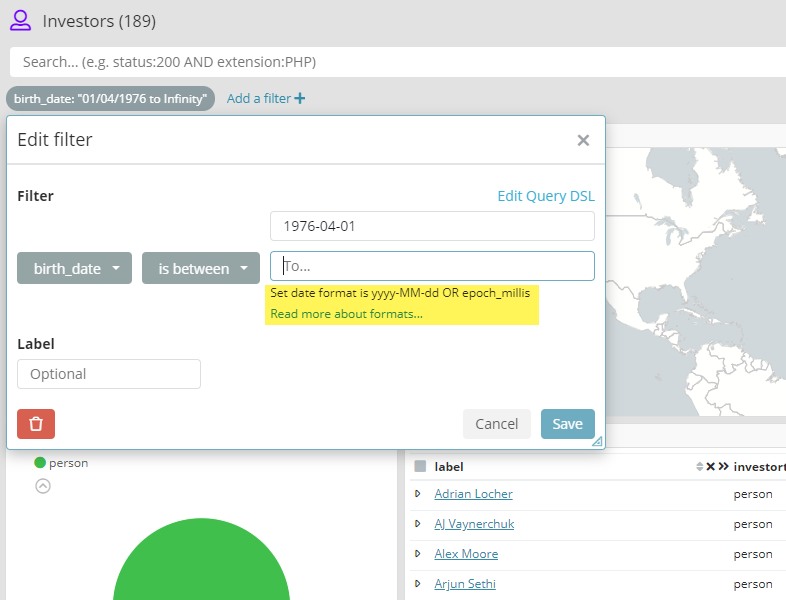
Improved time filter creation
There are so many ways to write dates is Elasticsearch it’s exhilarating, unless you have to write one manually on an index that someone else has created and which has been fixed to use one specific kind of format. We now show samples of valid dates to take inspiration from on the right template. Not rocket science like some of the rest but rather useful.
Improved relational model page with nested searches directly shown in the data model
Vast improvements have been made to the relational model page. This is at the heart of the configuration section where the Siren data model is edited and is now appropriately call Data Model (used to be separated between “index patterns” and “relations”). Not anymore.
In Siren data is organized as follow:
Indexes: These are in the backend. They can be either native Elasticsearch indexes or Siren Virtual Indexes which are mapped to JDBC datasources (e.g.: SQL databases).
Index Patterns Searches: They are either individual indexes (a simple index name in an index pattern) or a collection of indexes for example via wildcard, like “logstash*” which will collect all the indexes that start with ‘logstash’.
For users familiar with Kibana, these are the merge of the Index Pattern and the “saved search”.
Searches: Subsets of Index Patterns. For example, “Articles about Microsoft” or “Investments bigger than 5M”.
Entity Identifiers (EIDs): They are simply “classes” of values that are used to connect one index to another. An example of these might be “Social Security Number”, “IP”, “E-mail”, that are used on the graph and to relationally pivot from one dashboard to the other.
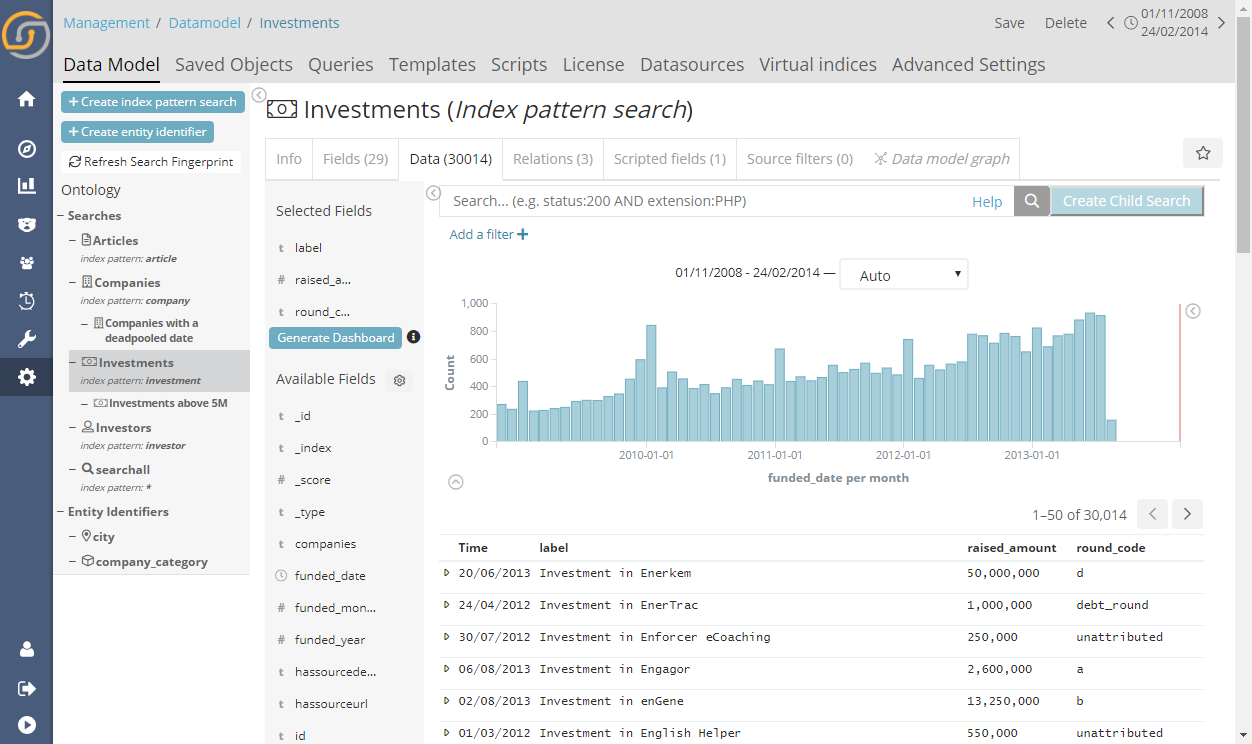
Typically, a user starts with the definition of “Index Pattern Searches” . Index Pattern searches have now a name which is different from the actual pattern used to find the underlying indexes – which can be changed anytime. This is a useful layer of indirection allowing one to easily change the data which data is being visualized e.g. in a dashboard without changing widget or dashboard definitions.
In the next image the new index pattern definition tab:
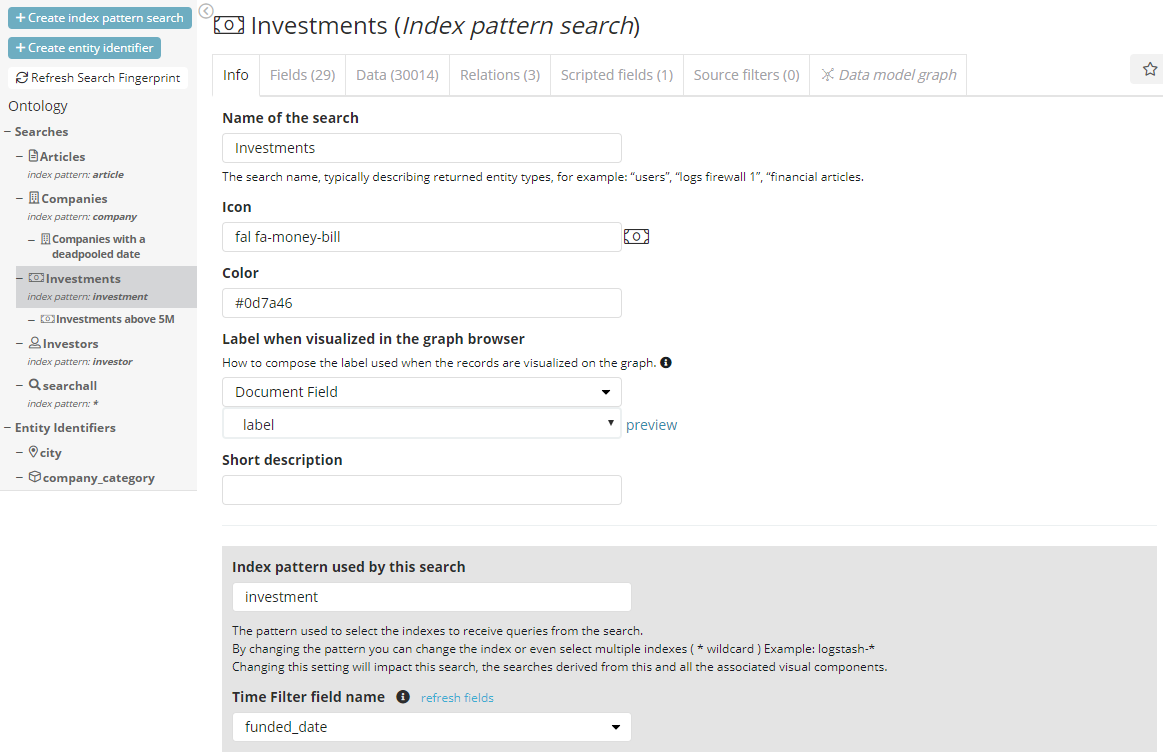
Yet another new feature is the users’ ability to navigate data values and search directly within this very same section, by using the “Data” tab. From here the creation of sub-searches can be quickly performed (simply called Searches) Once defined, all searches appear as a tree under the “Index Pattern Searches” they belong to, which can then be leveraged by the widgets for the different dashboards.
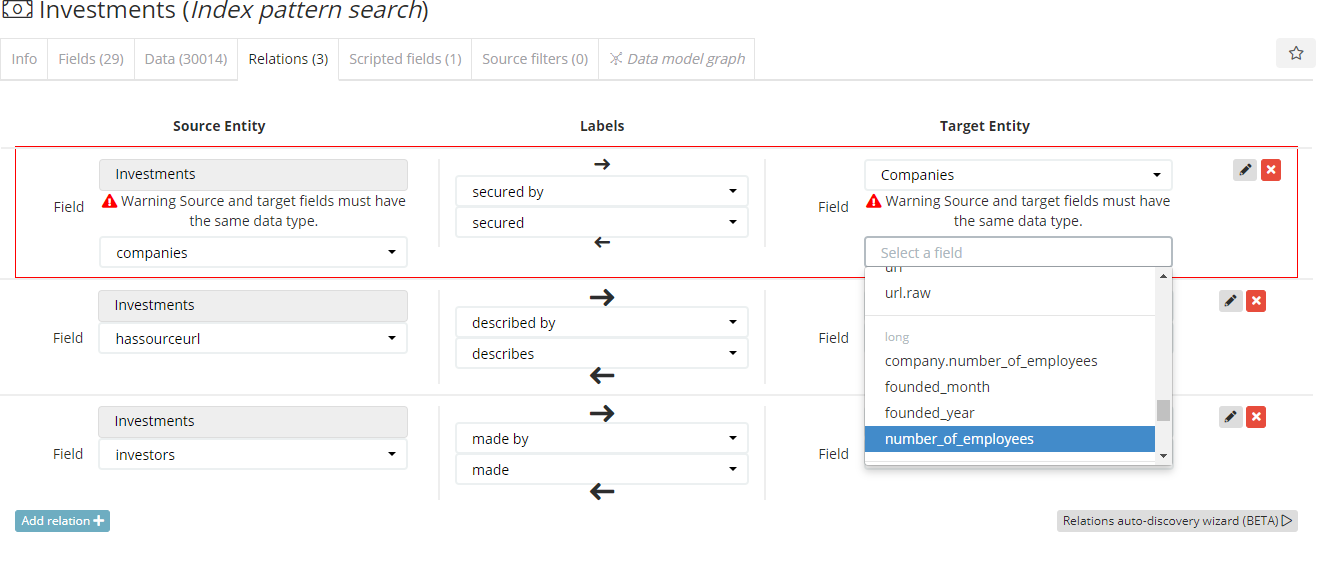
The relation tabs have also been upgraded, with much needed awareness of types in the joins, warning for incorrect join types and many other small improvements.
This section is the starting point for an exciting new feature, the Auto Relation Wizard.
Introducing the Auto Relation Wizard and Index fingerprinting
High on our request list has been the ability to automatically create a relational data model (e.g. infer index relations) and in general to understand better the content of all the fields at a glance.
We’re happy to announce the beta availability of the Index Fingerprinting and Auto Relations wizard abilities.
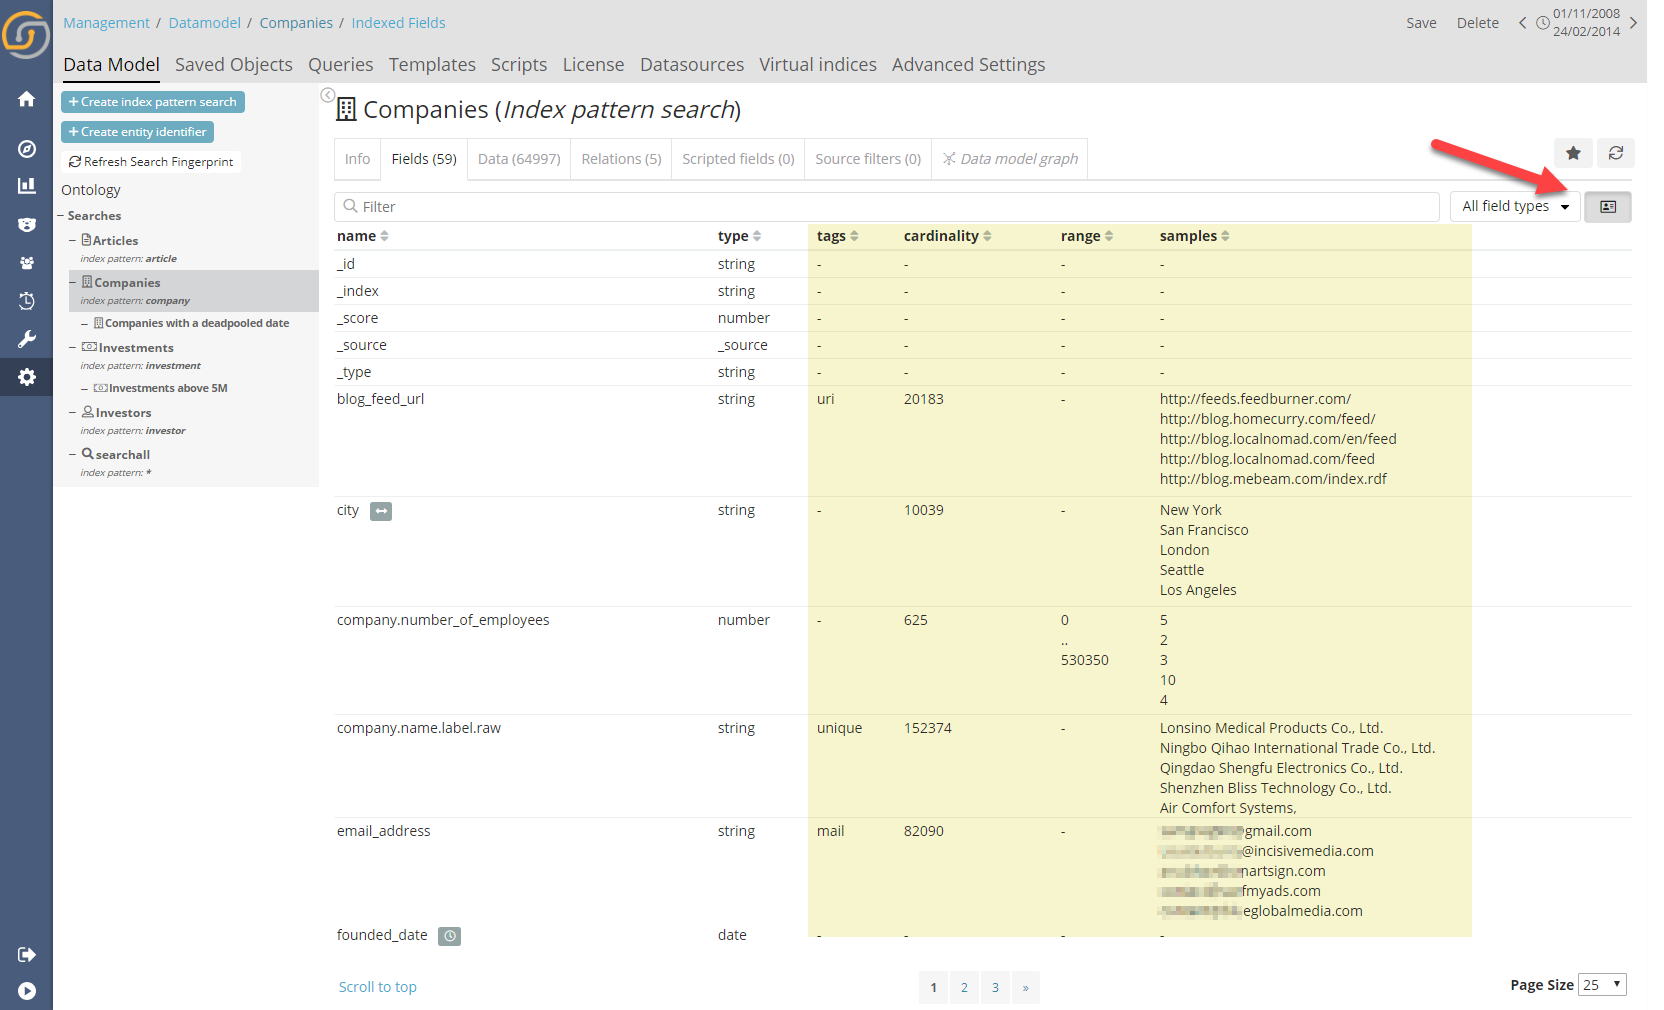
Index Fingerprinting is a prerequisite for automatic relations and is run automatically before any Auto Relation attempt, notwithstanding it can also be run independently. Fingerprinting runs a (reasonable) series of requests to the backend indexes, field by field and creates a model which represents the “essence” of the indexed. This “essence” allows high performance N to N field to field matching, but it is also quite useful to look at, when attempting to understanding the data for the first time. The fingerprint of an index can be seen in the “Fields” tab, pressing the show fingerprint button.
By a user doing so, it reveals “Tags” (which are generated by the analysis e.g. “unique” or “mail”, “IP”, “URI” etc. which can also be extended via configuration) as well as cardinality, range and samples.
The Autorelation Wizard.
Within the “Relations” tab, it is now possible to activate the “Auto Relation Wizard”. A user will first be asked for which index pattern search to look at (auto-selecting any new one that has been added since the last time it was run) and therein perform an analysis and display the suggested automatically discovered relations.
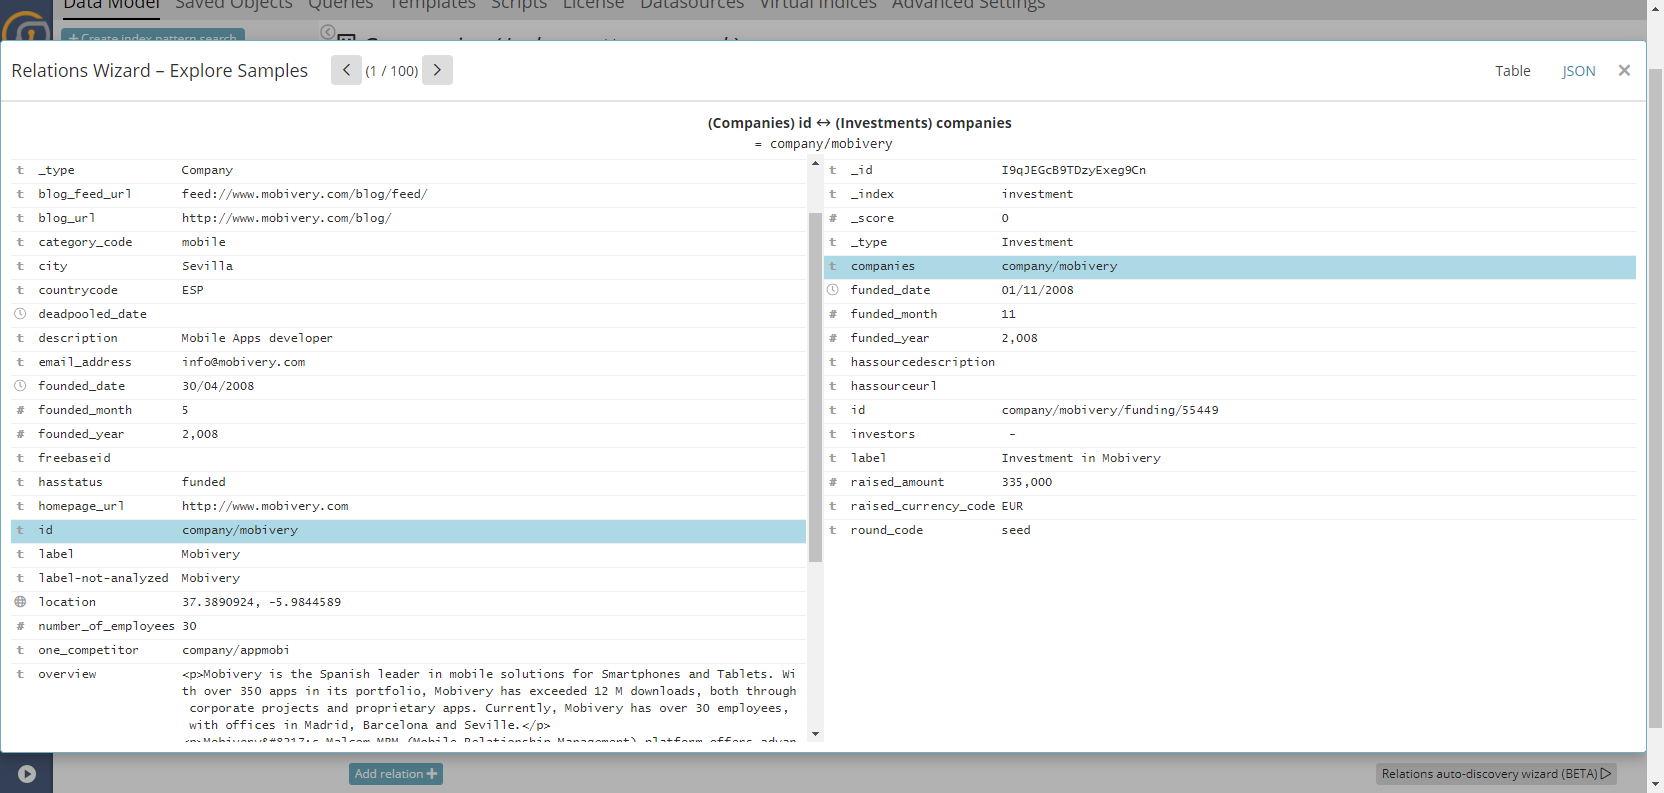
The first screen shown to a user displays the proposed relationships, where the he/she can explore, check and uncheck them at high level…
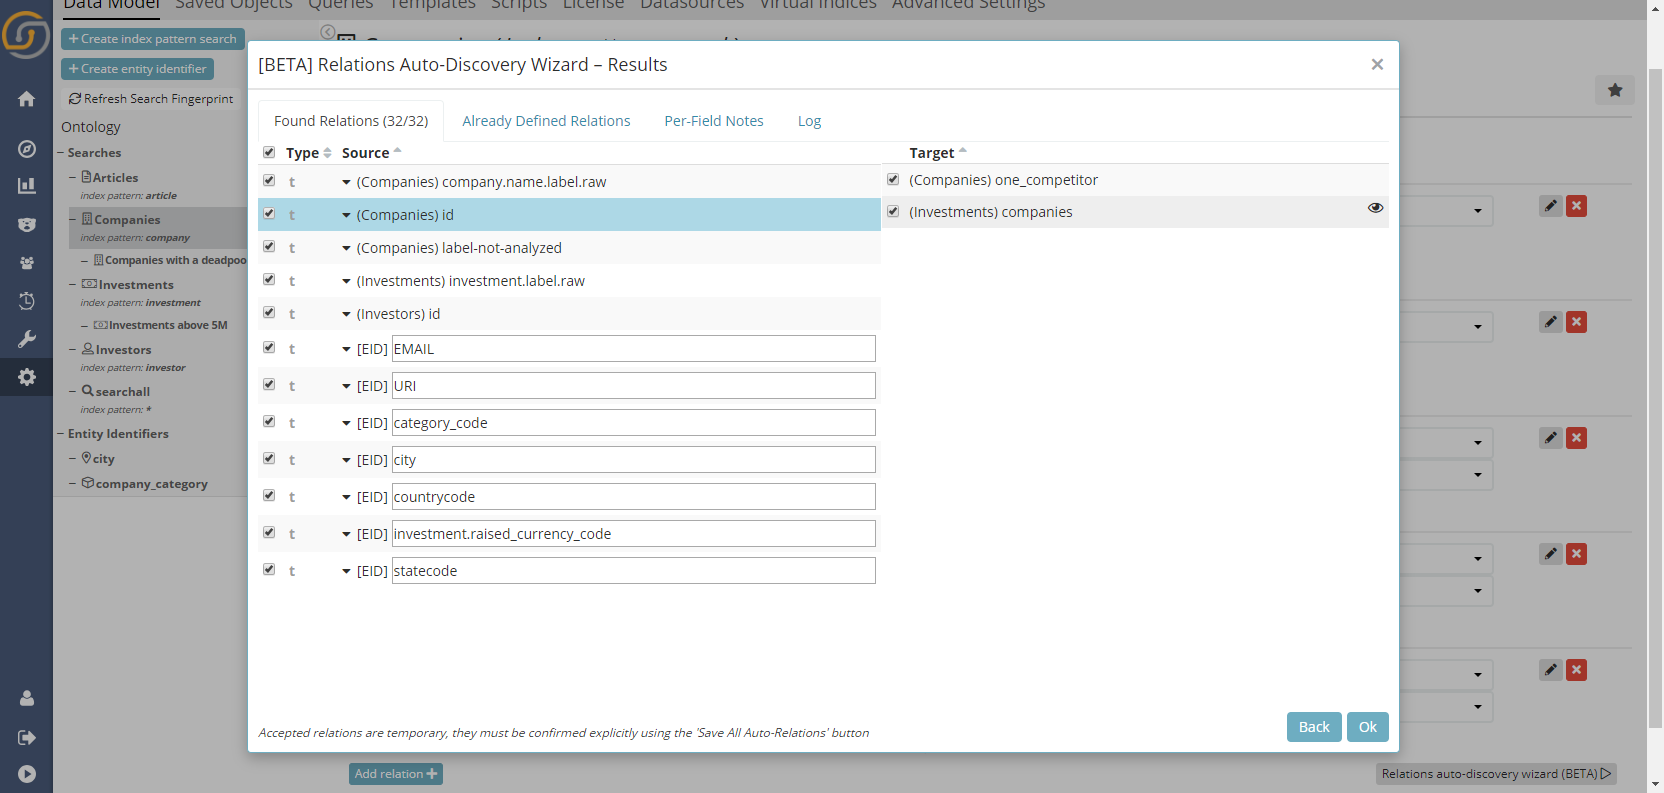
…or he/she can dive-deep looking specifically at example “joins” where both the left and right records are shown:
Once an automatic relation is created within the wizard, the relations will remain in “proposed” state. These ‘proposed relationships’ will be displayed with a different color in the Data Model , both in the “relations” tab and in the data model graph. It is possible to, even at this state, to confirm or delete them.
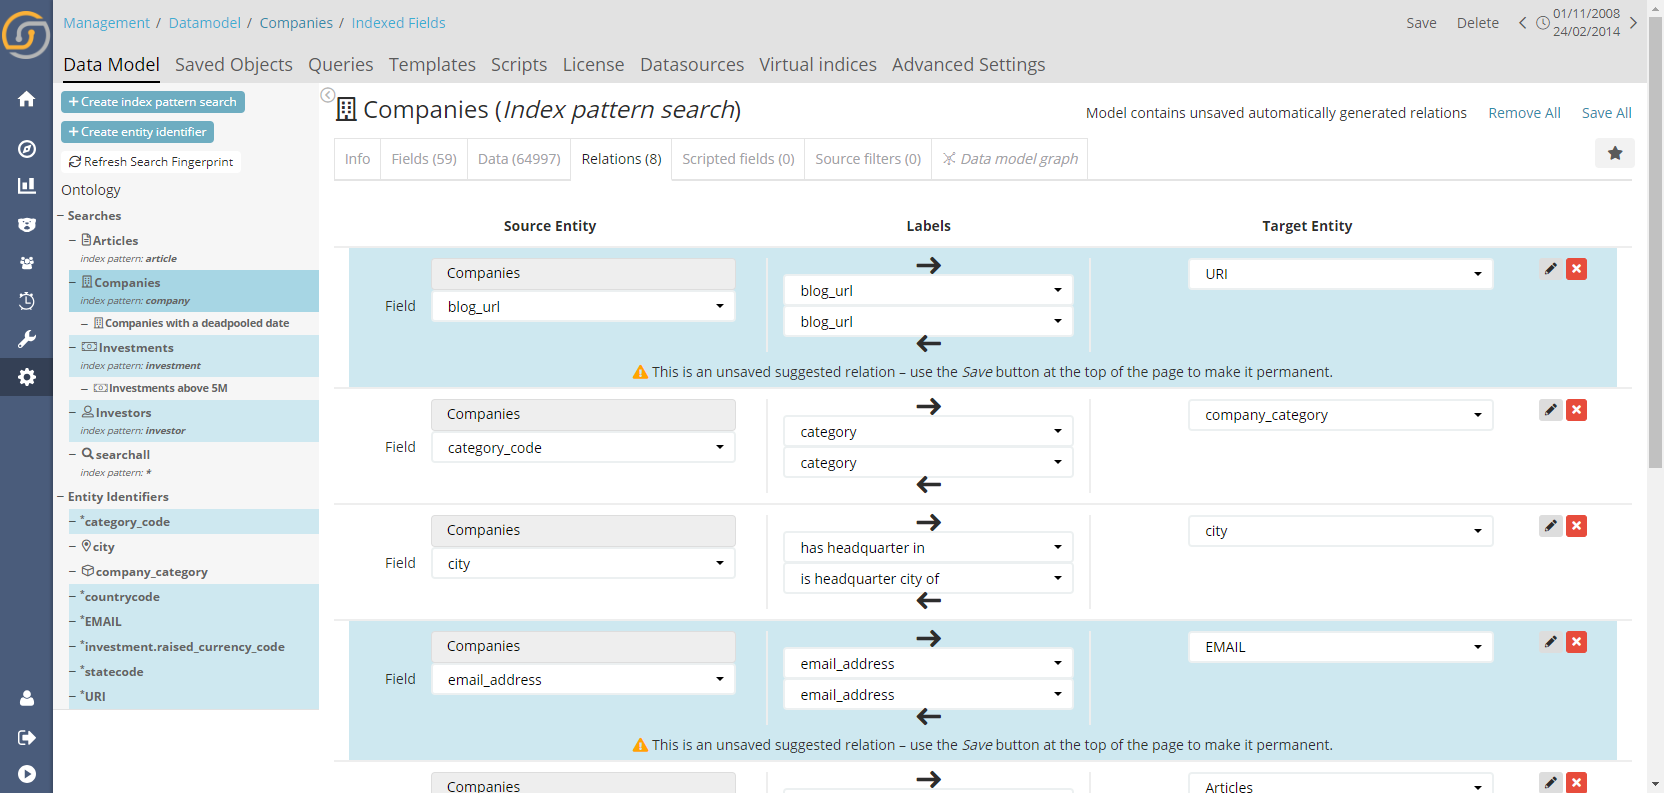
In the screenshot above, the Auto Relation Wizard found many more links than those that are configured by default in our demo data. The interesting thing is, we didn’t even know ourselves about these until we ran the wizard.
New plugins: the enhanced table with pivot mode, the enhanced tilemap with layers
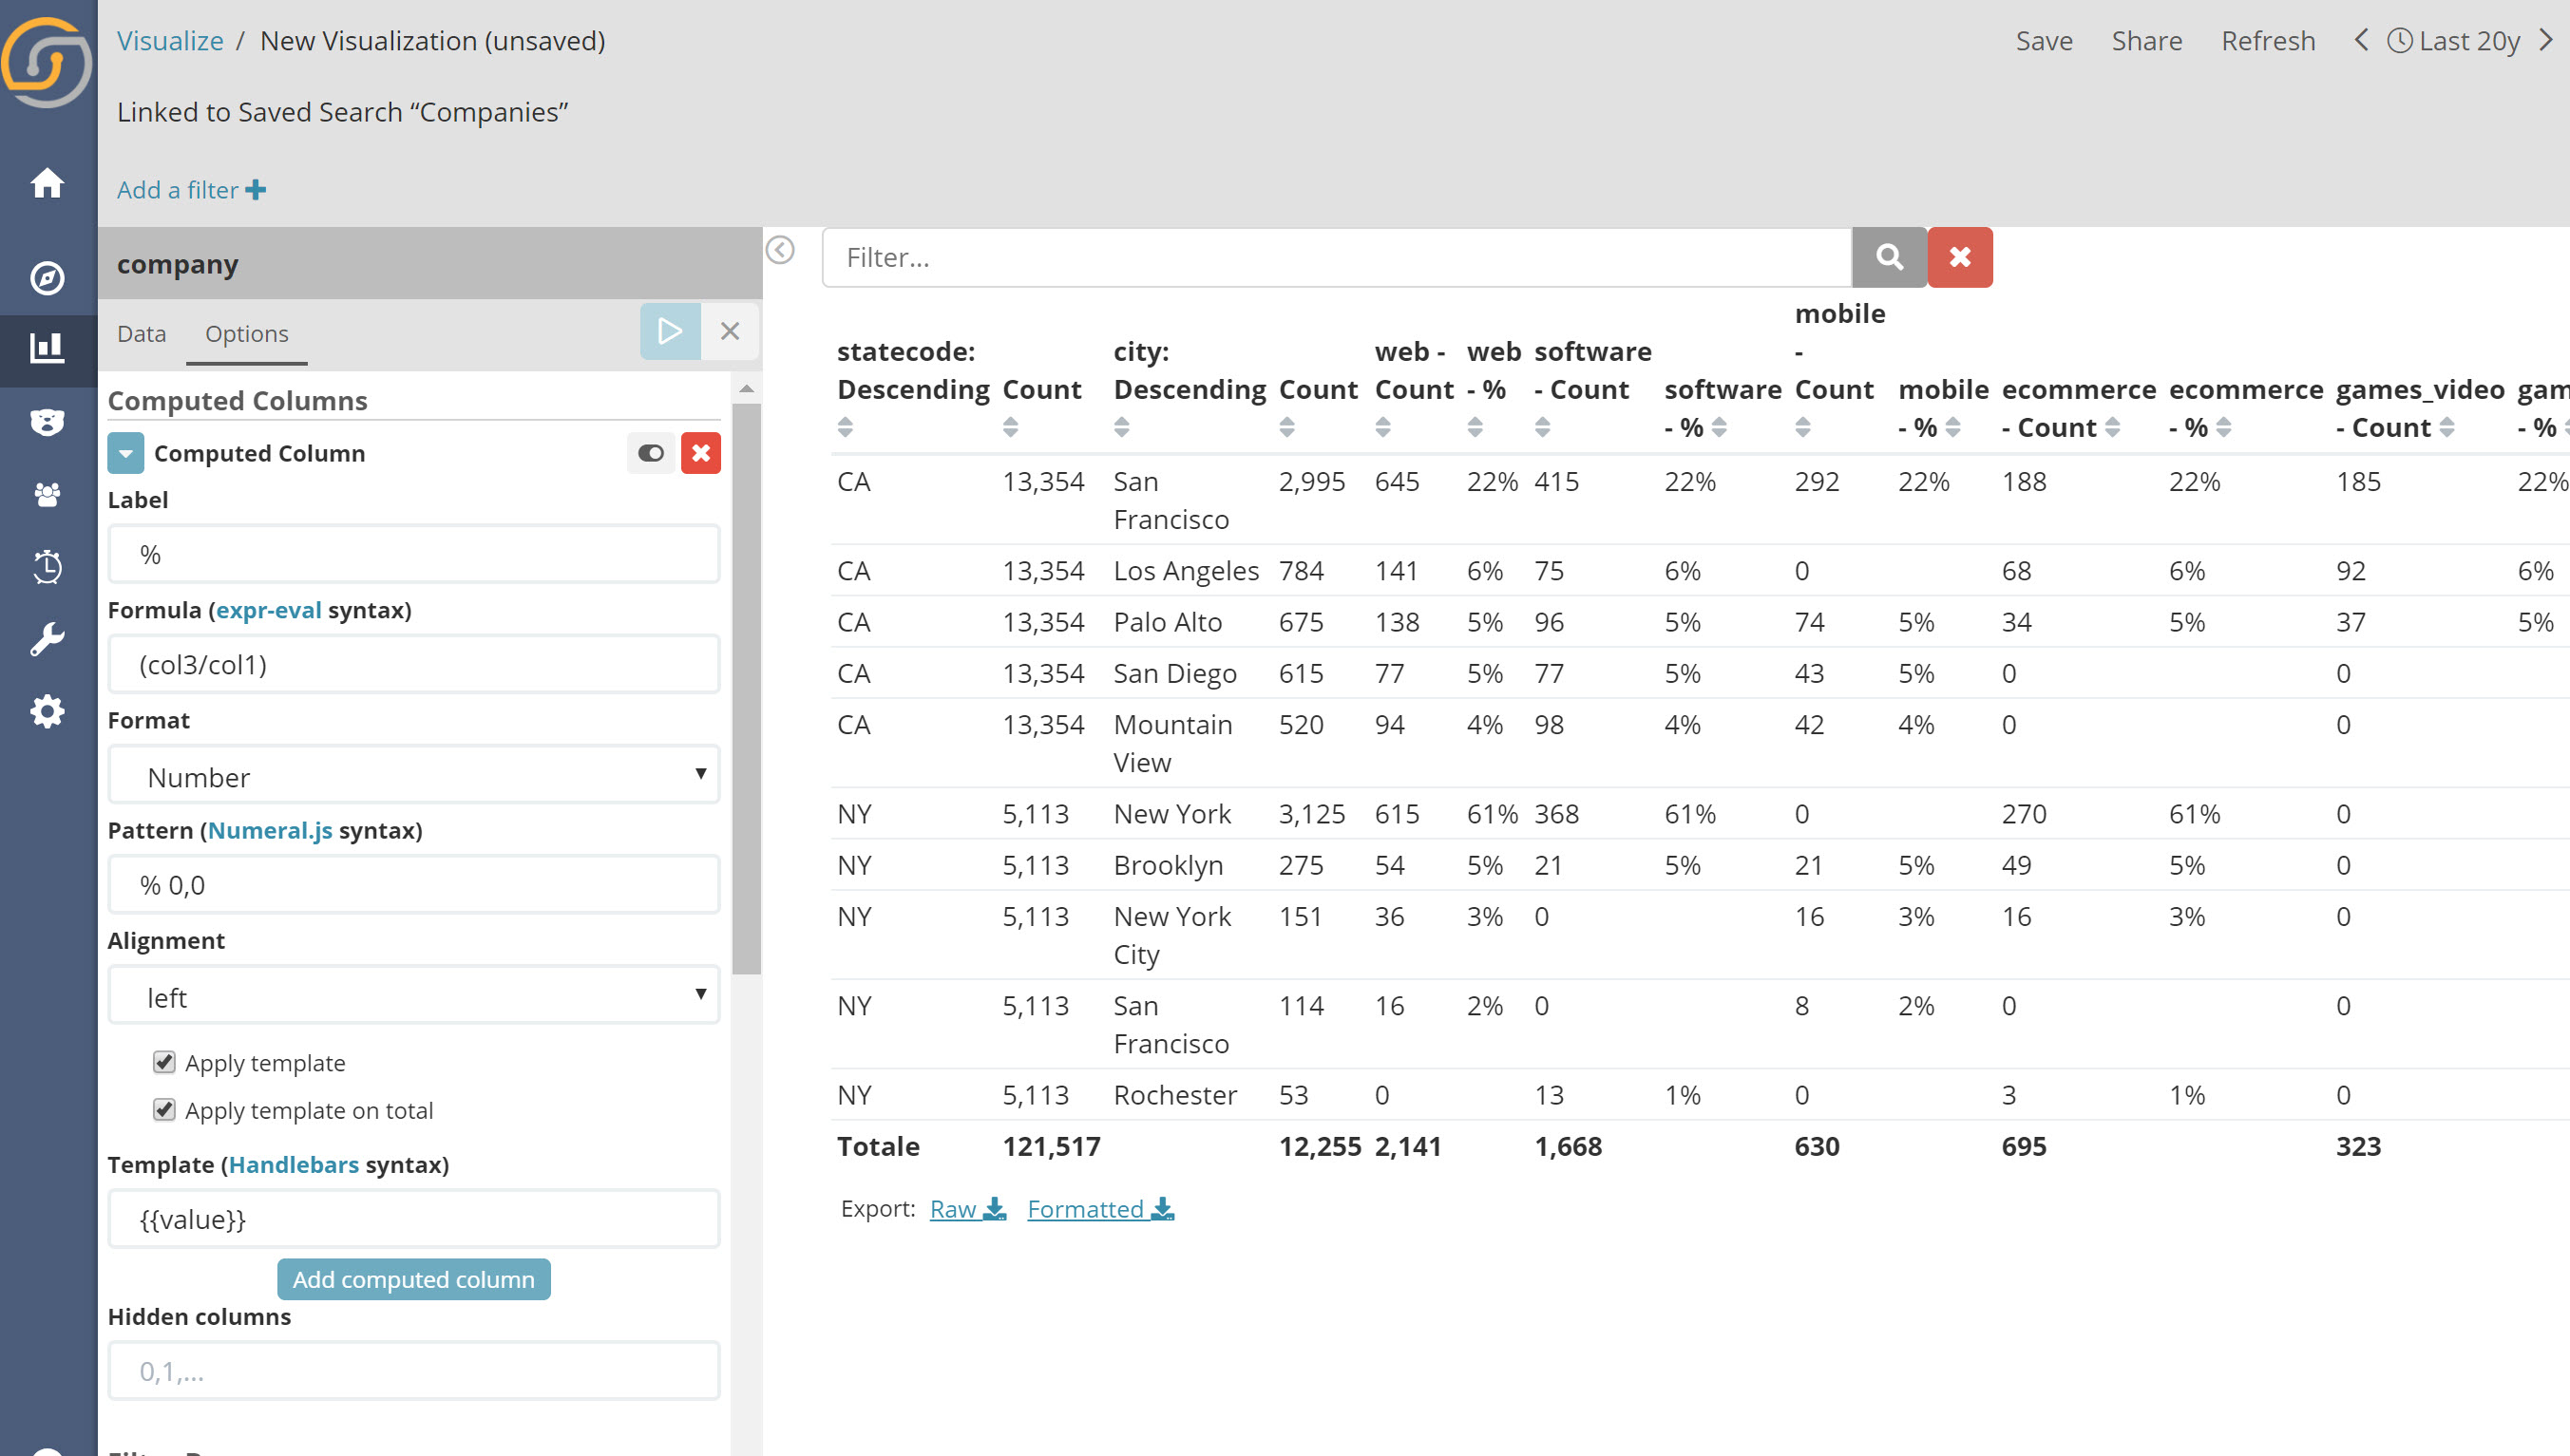
A new “enhanced table” plugin is available and set to replace the stock one. This is a port of the great work by fbaligand, featuring:
- Pivot Table capabilities (Group by columns)
- Calculated columns
- Search bar and many more advanced features with high practical impact.
- Others: hide export links, hide columns, show roll up totals
Here it is, in action:
New plugin (beta): introducing the high dimensionality correlation explorer – Parallel lines
To explore the value distributions of a single variable, a bar chart is sufficient. To see the correlation between two variables, a scatterplot or a heat map is in order. But how to explore correlations among many variables?
Siren 10.1 now includes a “parallel line” chart which makes use of the big data aggregations to show how cluster of values correlate with each other, at high dimensionality.
As a basis, it offers scatterplots for each couple of variables, then permitting the user to see how each point connects across the other variable values. Filters can be placed both on scatterplots and on the columns. View the following video analyzing our classic investment/company dataset.
Disclaimer: This is a beta release, some rough edges remain. Looking forward to hearing your feedback
Excel/CSV easy (and powerful) imports
Being thrilled might be an understatement, when addressing how we feel when being able to announce the introduction of a quick an intuitive way to add data to a Siren installation.
Thus far Siren has been only capable of showing data on JDBC sources or on preloaded Elasticsearch instances, the new Excel CSV easy import wizard allows anyone to add its own data and use it for enhanced investigative intelligence.
The process being as easy as dropping a file into the UI.
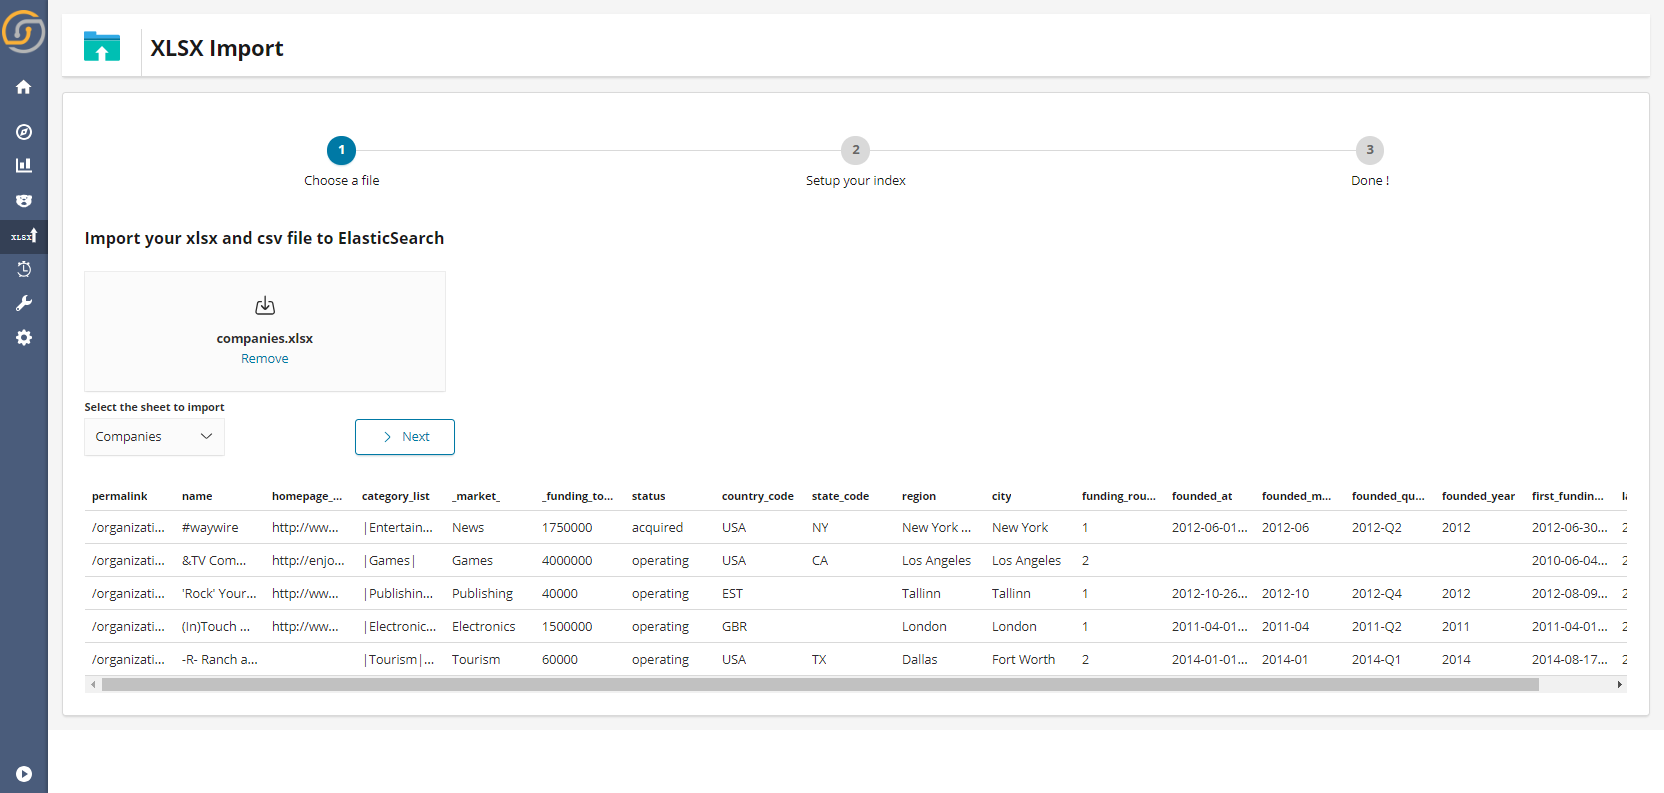
The user must then simple choose how the fields are indexes (are they meant to be “tokenized” to create word clouds or used with no splitting such as for tags so that “New York” does not become “New” and “York” )…
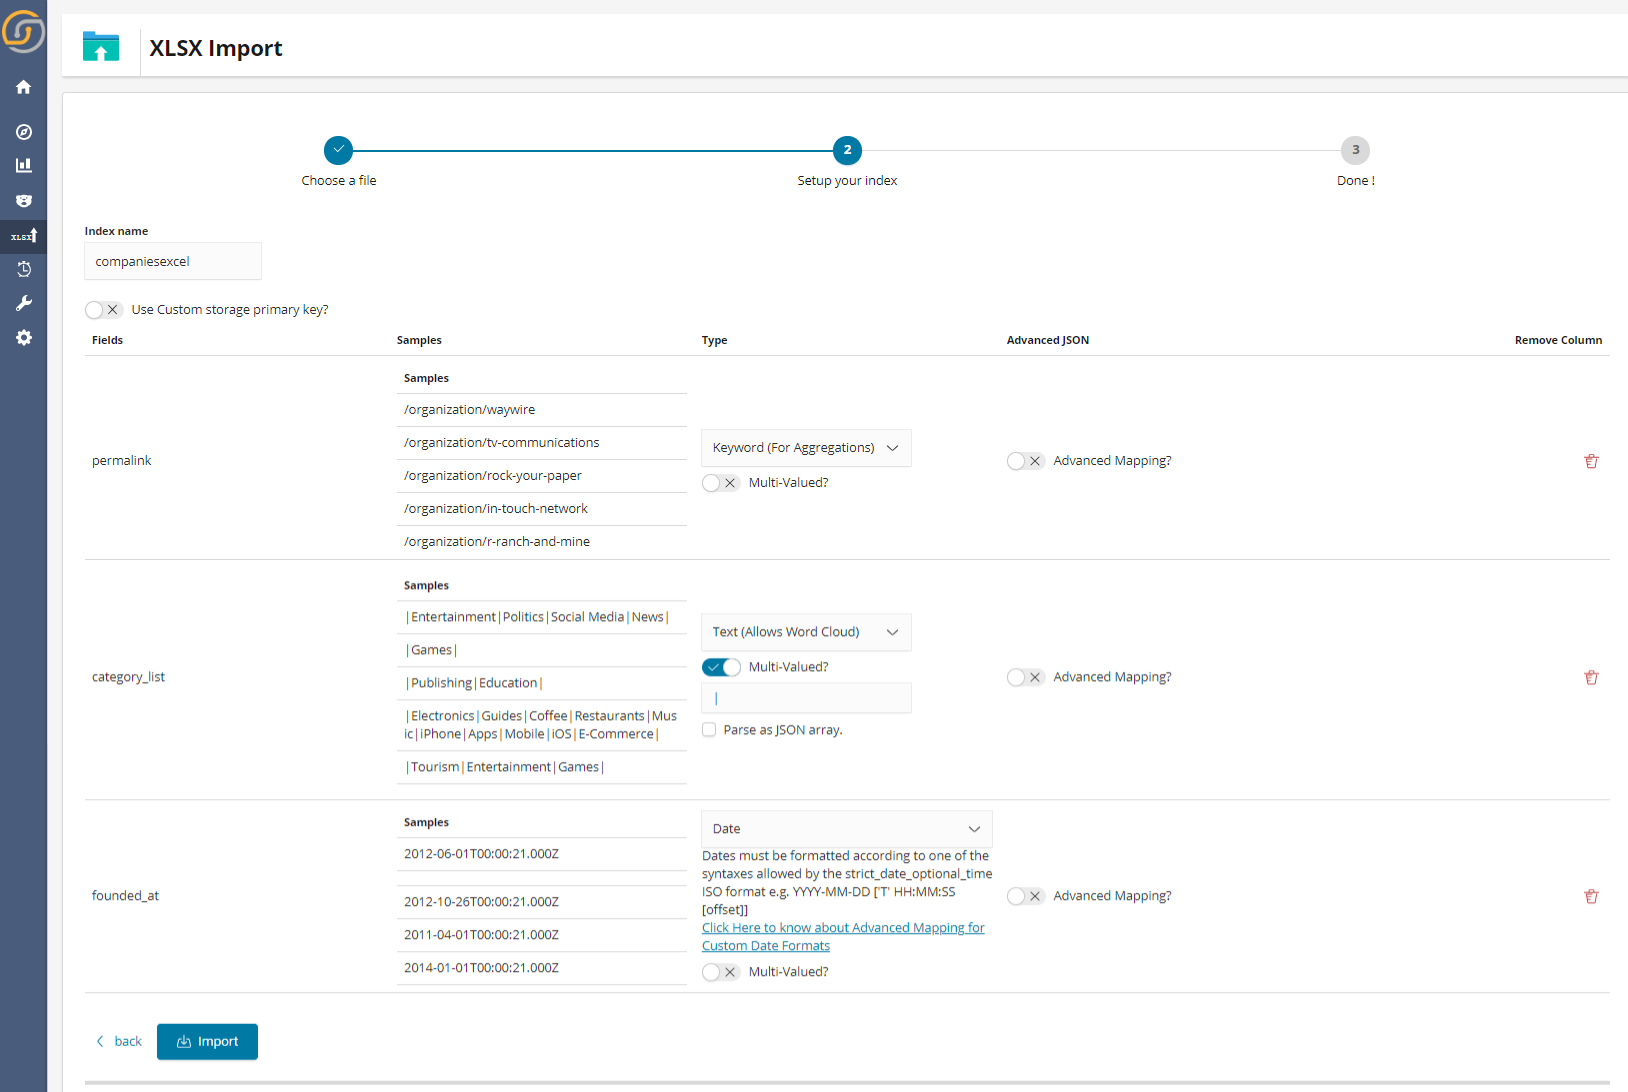
…And we’re done.
While apparently simple, the workflow allows also for:
- Re-indexing after modification. For example, overwriting the old records while adding the new ones.
- Re-using previously created settings per field. This would allow for a new spreadsheet with the same format likely be indexed correctly out of the box.
- Dropping previous indexes/spreadsheets.
- Filtering by spreadsheets imports by “upload date”.
- Getting a report on correctly/incorrectly indexed records, with details on the errors that were generated at indexing time enabling easy rectification by reverting one step back to the wizard.
All features are also compatible with access management control, thereby users only being typically able to have access to the files he/she has uploaded.
Federate: Support for Elasticsearch 6.3, performance improvements, job cancellations, job throttling, bug fixes
Siren 10.1 comes with support for both ES 5.6.10 and ES 6.3.2.
Additionally, two new features have been added to Siren Federate: job cancellation and job throttling.
The Siren Federate query execution engine has been integrated with the task management API of Elasticsearch, providing the ability to cancel on demand the execution of a search request including join operations. This is particularly useful when wanting to halt the execution of a search request that is not needed anymore to reduce unnecessary load on the cluster. For example, this functionality is used in Siren Investigate to cancel any search request that is not completed when switching dashboards thus generally improving the responsiveness of the UI.
A priority-based throttling mechanism within Siren Federate has also been added to better manage the consumption of resources used during the execution of a search request. This allows Siren Federate to better handle concurrent workload.
With respect to bug fixes, the most notable ones are:
- Added the support for joining floating points
- Indices options are now properly propagated to all the tasks of the query plan
- An exception was thrown when prefiltering search phase was triggered
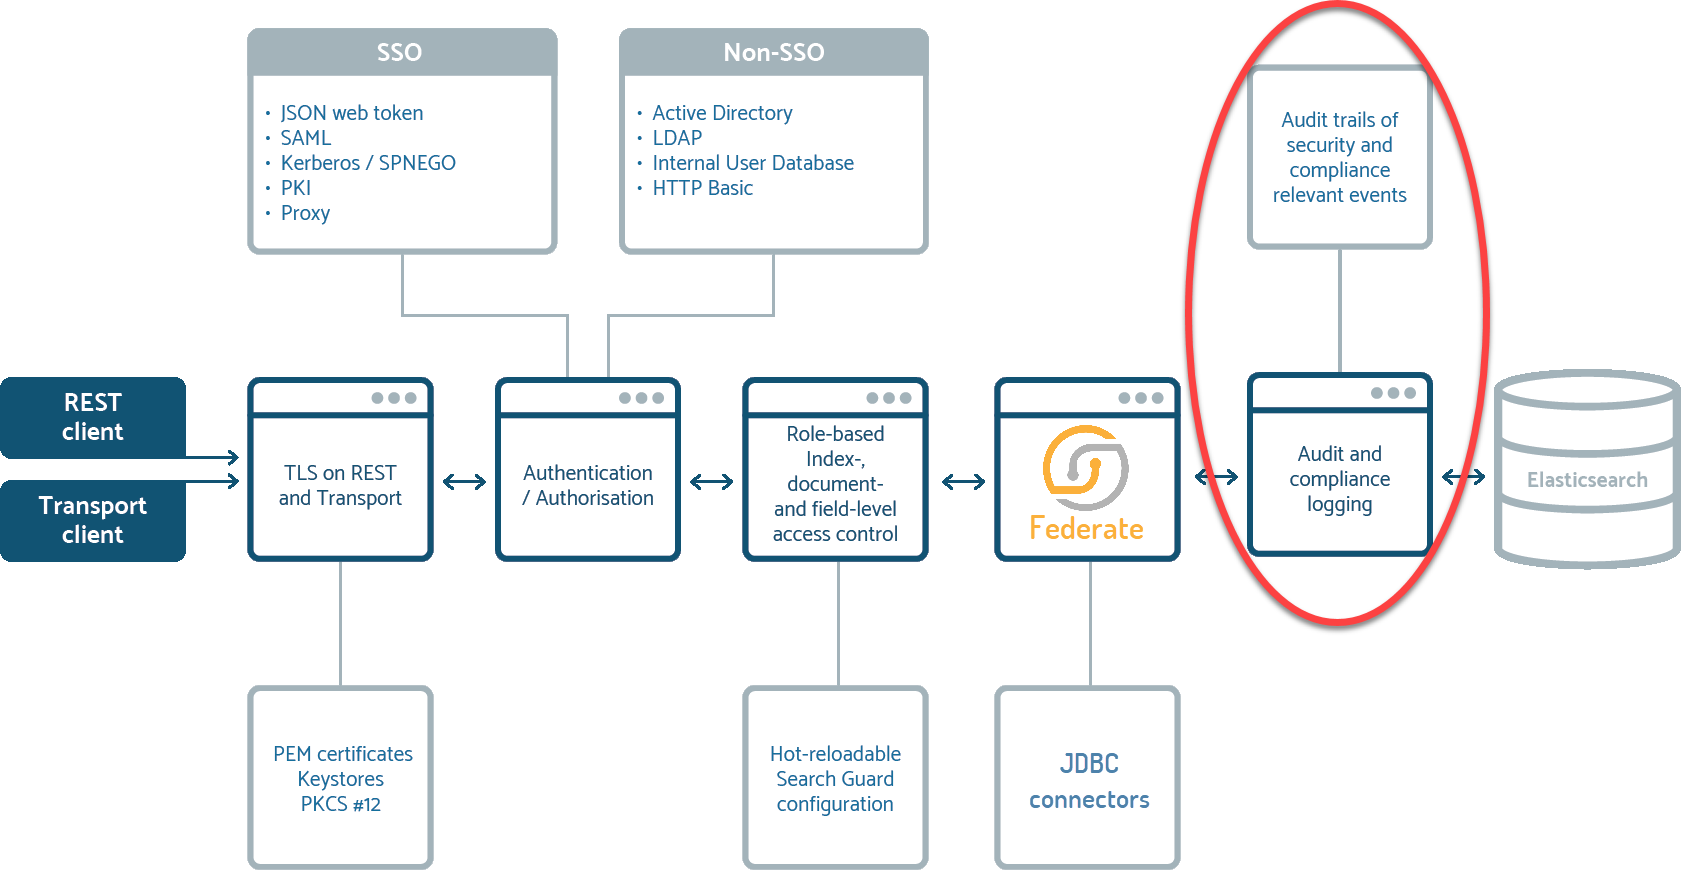
Access Control: GDPR and Compliance features (Advanced security settings)
Siren 10.1 now ships with Search Guard Compliance Edition which in itself entails a host of new features among which:
- Read history audit logging – who read a certain field?
- Write history audit logging – who changed a record?
- Field anonymization – pseudo anonymization which
- Immutable indices
- Event routing
- Elasticsearch installation monitoring
The following diagram, although simplified, provides a fairly accurate representation of the invocation chain involving Siren Federate and the new audit and compliance modules.
BigQuery and Denodo support, improved Oracle, improved performances
Advanced client settings in Oracle are now supported, with the notable addition of Big Query and Denodo as part of our supported JDBC drivers.
Alerting: visual wizard for threshold alert creations
Siren Alert has a new visual interface for easily creating threshold-based watchers, called the Watcher Wizard.
With this wizard, users can quickly describe the query and criteria, then visualizing the trigger conditions with existing data.
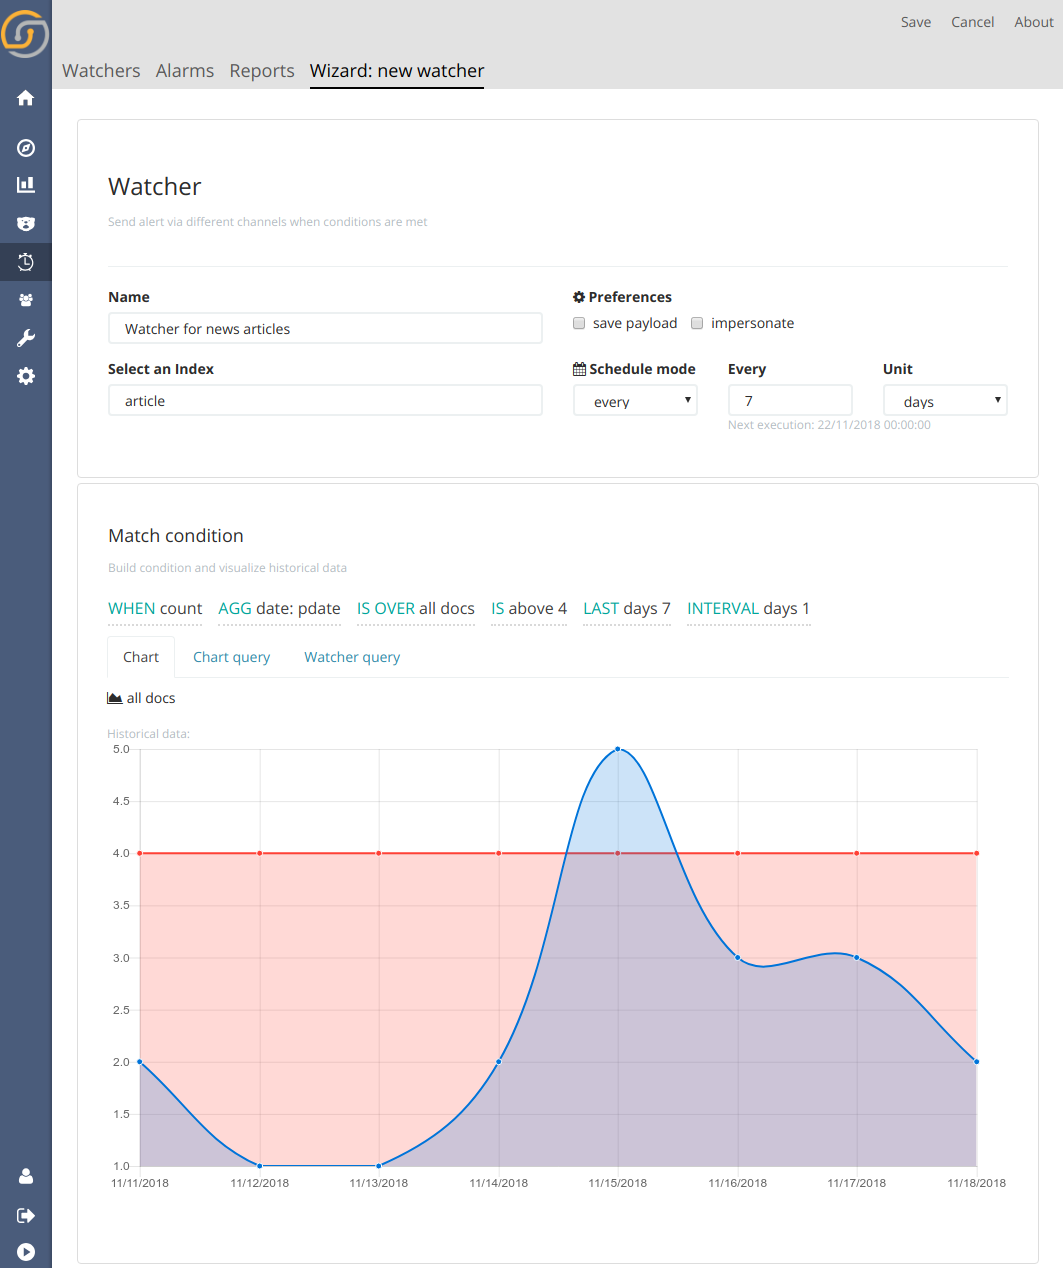
The wizard also allows to more easily compose and configure a variety of actions that are performed when the data matches the condition. Action content (email messages, webhook body, etc.) uses templating so that watcher configuration and query results can be referenced in the action.

Alerting: context sensitive templates alert wizards
It is not uncommon for financial analysts wanting to receive emails when a new piece of news appears matching complex filters.
To accomplish this within Siren Investigate, a user only needs to perform the following steps:
- Place the filters on the dashboards as required. For example, in the below shown screenshots only companies that compete with those which received investments from a given investor are displayed.
- Secondly select the “watcher button”.
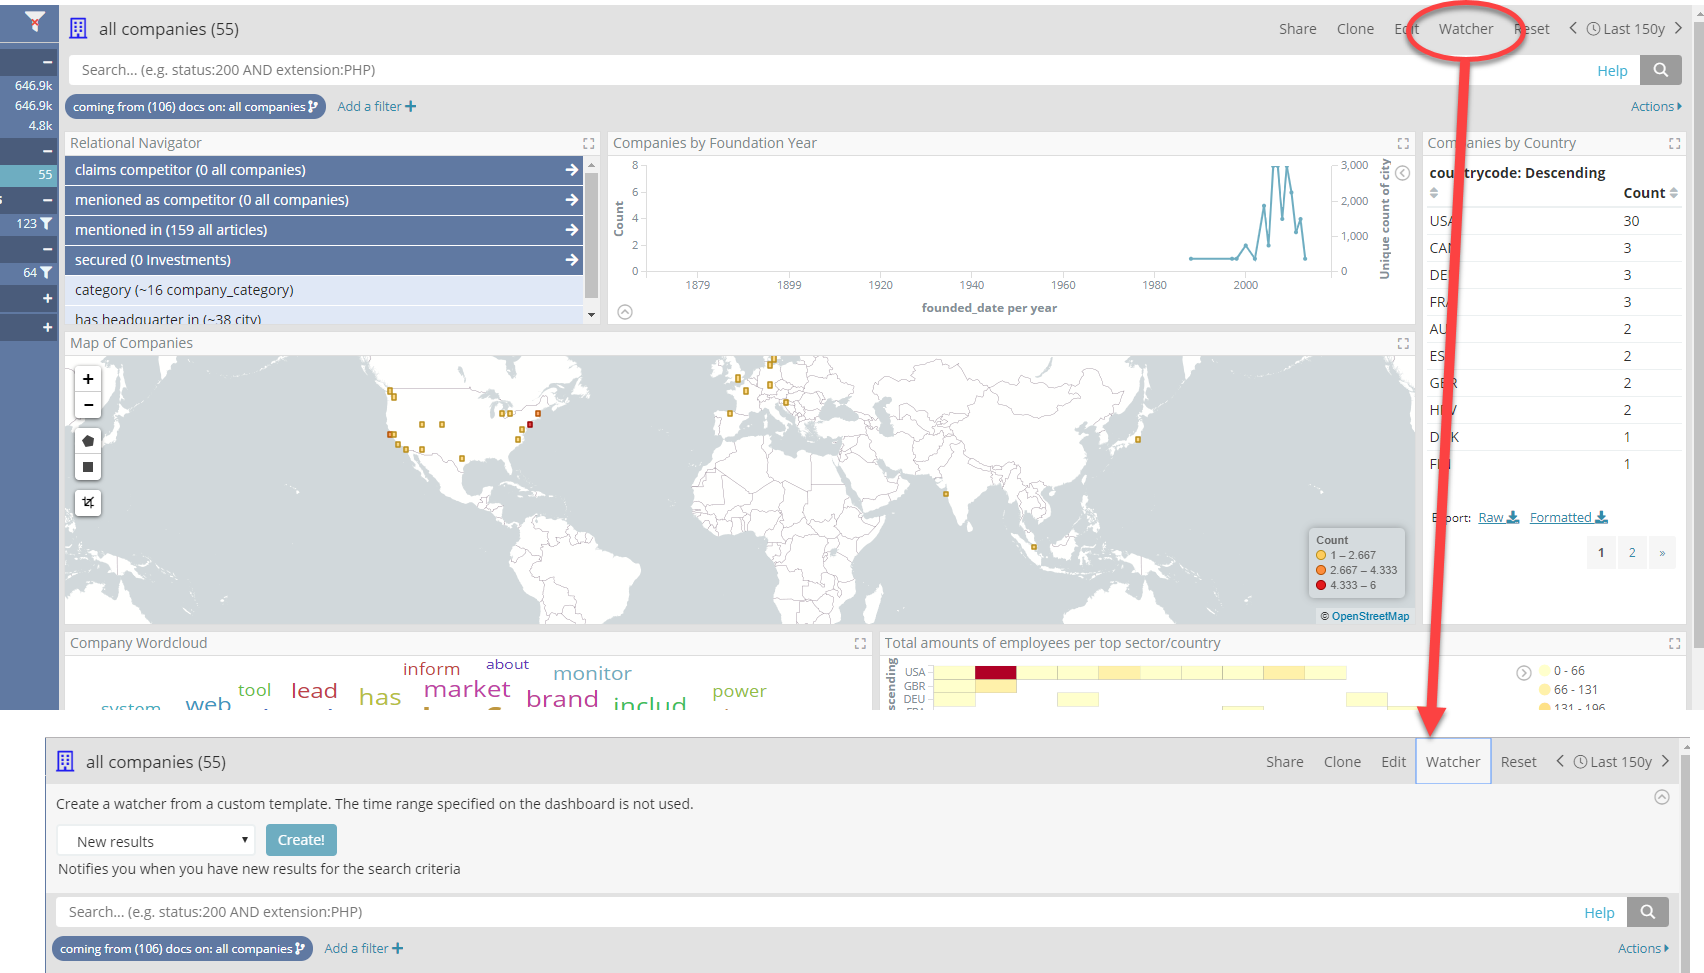
This is possible thanks to Siren new “context sensitive templated alert wizards”. These are simple to create wizards, created in JavaScript and installed by administrators, which contextually activate given the dashboard/search/widgets or data that the user is currently browsing.
Full stack support for ELK built in the subscription
Our subscription model now includes full ELK stack support when Siren is not installed from scratch but as an “power up” to existing Elasticsearch deployments. A Siren subscription is now a one stop shop for intense operational scenarios.
In Summary and our next stop
In summary, 10.1 might look like just a .1 release, but quite obviously there is nothing minor about it.
Siren vision is that that any sufficiently large or complex organization requires nothing less than the best tools to understand and leverage how critical organizational data is interconnected.
We believe Siren 10.1 represents today both the best and the most all-round flexible tool in existence – stay tuned for major innovations we’re cooking for 2019, including strengthening of graph query capabilities, live webservice integration and interactions in the frontend, UI driven data ingestions and preparation, a myriad of ML/AI features just to name a few.
Get Siren 10.1 now for a spin. Or contact us to arrange an assisted POC.


