

Evaluating a superhero performance can be tricky … but Kibana/Kibi can help!
Say you have loaded your Elasticsearch with a bunch of reports and ratings by people on how they think superheroes have performed across a number of episodes. They are rated 1 to 10 on different dimensions, e.g., “intelligence, strength, energy, speed”, etc.
How to get a real overview of how they performed globally?
The Kibana/Kibi Radar/Spider chart
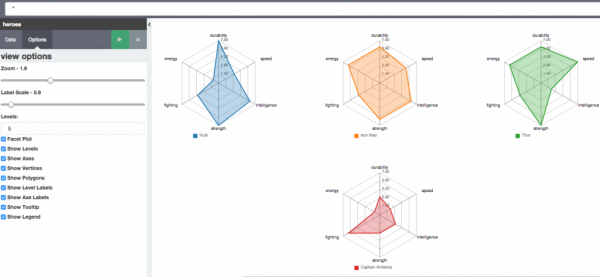
Yes, the best way to evaluate how “all round” is a superhero might well be a … Spider Chart Radar Chart … which we are happy to announce today as a component for Kibana and Kibi.
Here it is in action, averaging the scores people gave over a number of episodes …
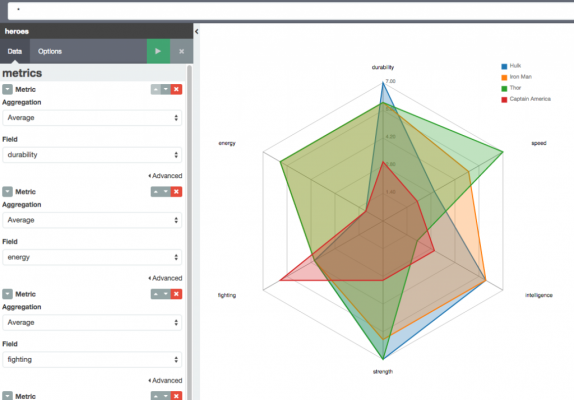
Or for those who like their dashboard compact …
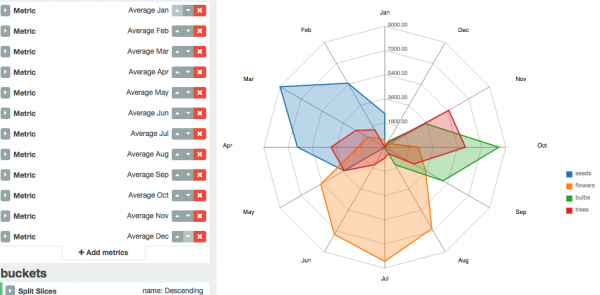
On periodic timescales
Other uses? well … what kind of seeds are most sold year round? This should beat your average histogram …
More uses
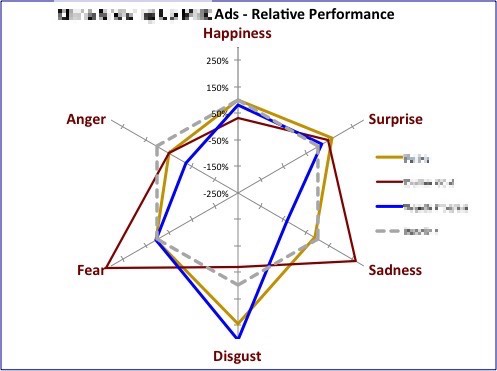
If you are not tremendously into superheros, you might be interested in knowing why we developed it in the first place, which is for a use case in multidimensional “emotion” analysis (courtesy and sponsorship of the Mixed Emotions project).
For example, how “happy, surprised, excited, etc” certain news or reactions are. Something like the graph below (unfortunately not made with this component – we do not have the data yet.
The component is Apache licensed, so free for all uses. Get it and or fork it here.
Goes great with your Kibana 4.3.x+ and Kibi 0.3.x+ (ops, not released yet – give us another couple of weeks, in the meanwhile enjoy Kibi 0.2 which is pretty awesome anyway)
Like it?
Want more? Share the word:
- Tweet this now
- Don’t miss announcements from us (sign up below)
- Sign up to our youtube channel – and if you have not seen the Kibi video, they are worth your time
… and by the way if you around San Francisco next month See you at Elasticon – we’ll be around the area that week.


