
In Life Sciences there is (finally) a wide understanding that it is valuable for all to share and contribute to open “precompetitive data”.
More and more often, very large open datasets exist.
For example, the ChEMBL bioassay data, for example, ChEMBL or ChEMBLdb is a manually-curated chemical database of bioactive molecules with drug-like properties, maintained by the European Bioinformatics Institute (EBI), of the European Molecular Biology Laboratory (EMBL).
ChEMBL is reasonably large.
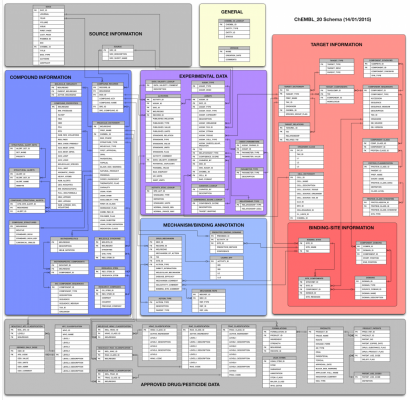
It is distributed in compressed Postgres, Oracle or Mysql dumps which turn into well over 20 million records, interconnected across 63 tables.
A quick peek at the schema might give an idea of the complexity involved. (Colors are used to group together related tables).
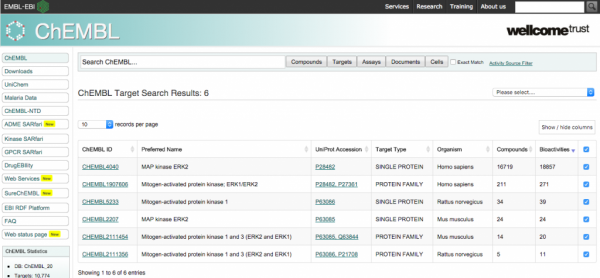
Chembl is accessible today via a useful web interface, which focuses on the search of records via its direct properties. e.g. specifying the name of a target or some metadata which is otherwise contained in the record.
This leads to record listing, which can be clicked to reveal relatively simply analytics (E.g. counts of activities and aggregates).
The Pain
On one hand, data scientists have such simple tools as the navigation above, on the other hand, they may of course download the SQL dump and process it via very advanced, but hard to use, tools (SQL, Matlab, Python, R, you name it)
While the latter tools can in theory “do all”, they require very specialized competencies and are clearly unsuitable for quick effective data browsing e.g. to obtain answer live while dynamically exploring data.
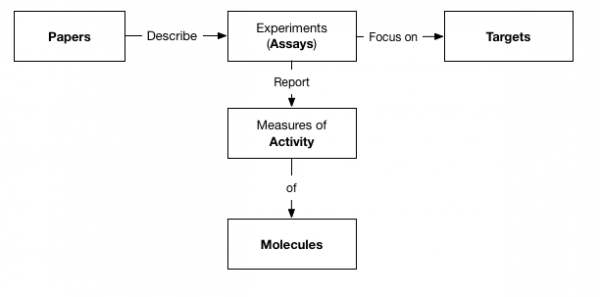
e.g. “Are there many targets that are related to papers that have been studied in the last 2 years and have reported active results on molecules of this kind? (and could you please plot this in barchart clearly highlighting which organisms they refer to, thanks)”
As today, the answer only comes after writing a long, painful, error-prone, SQL query + other tools as required for charting.
Now lets try Kibi/Kibana
Kibana provides the amazing data search and beautifully configurable analytics/charting to answer the second part of the question, but it is thanks to the Kibi extensions that we can zoom in using relational filters.
All we have to do is simply load things up into an Elasticsearch cluster.
In this very quick example, we used the Logstash JDBC connector to create 5 indexes in Elasticsearch, relationally interconnected via ID properties as follows:
Note that these indexes do not reflect 1 to 1 the original tables as they incorporate data from several related tables as needed.
E.g. our “Targets” index incorporates all the “Target Synonyms” (sql table). As Elasticsearch (same as Solr) beautifully handles multi-value attributes so its ok to do so as no loss of search precision will occur (it would in SQL if we were to put simply data together).
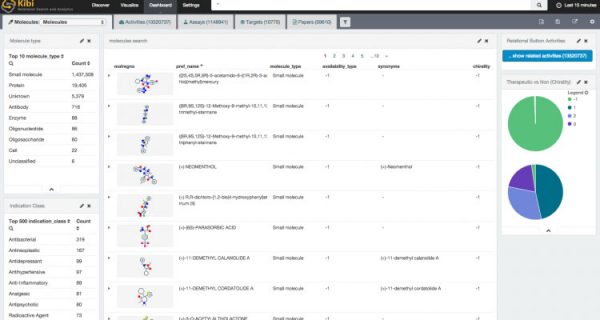
At this point, the rest is nothing else but simply configuring Kibi from its user interface.
A few “visualizations” and “dashboards” laters (..and thanks to the NIH online service for rendering molecules as a PNG).
Now, just add your secret research data
Just as easily as it was possible to load this data into Kibi (full, quite simple, configuration here) it would be straightforward to load any sort of additional data into the same Elasticsearch cluster, starting from the 50 or so tables we left out from Chembl to any non precompetitive data one might have.
By doing so, one would be able to browse it and relate it to ChEMBL – as well as any other dataset – just as easily as was demonstrated in the above demo.
And of course, If you’d like some support on this, we’d love to help.
But how fast/fun interactive is it really?
Here is a 4 minute screencast recorded live, you judge.


